Custom alerts and data visualization let you quickly identify and prevent poor availability, slow response times, data errors, and other ERP software performance issues.
ERP software streamlines your business, enables different teams to work together more effectively, and gives you critical data you need to make well-informed business decisions, adapt to changing circumstances, and plan for the future.
But it’s also extremely complex. And, if there’s an issue in one of the modules, even if it’s minor, the whole system can come to a standstill. Which means your organization will come to a standstill, too.
With so much at stake, you need to watch your ERP solution like a hawk. And, with Paessler PRTG, you can do so without having to literally stop everything else you're doing to check health and performance stats by hand. It's simpler. It's more accurate. And, most of all, it monitors everything round the clock.
How's that for peace of mind?

Monitoring your ERP system with PRTG is the best way to stay on top of things and deal with problems before they cause real trouble and even become business critical. Here’s why PRTG is the ideal solution for you.
Set up in minutes (almost) without lifting a finger. The automatic network discovery scans your network for ERP applications, modules, and hardware that make up your system and assigns the appropriate sensors. There's nothing for you to do, unless you want to customize your monitoring environment to suit.
ERP software is mission-critical, and unplanned downtime or disruptions can spell real trouble for your organization (and very angry higher-ups). PRTG keeps a close eye on key metrics round the clock, promptly alerting you about potential issues so you're never caught on the back foot.
You don't need to install specialized software agents or clients (though you can use it as an agent-based monitor if you want to). PRTG uses protocols like SNMP, SSH, and WMI, and remote monitoring functionality, for pinpoint-accurate monitoring that's gentle on your resources.
No more switching between several different monitoring environments. PRTG brings critical data about your ERP solution – and your entire network, whether it’s on-premises or distributed – in one place, giving you unparallelled, end-to-end visibility into its health and performance.
Diagnose network issues by continuously tracking databases, business processes, servers, and other network components that impact ERP software performance. Show bandwidth, availability, response times, and other key metrics in real time. Visualize monitoring data in clear graphs and dashboards to identify problems more easily. Gain the overview you need to troubleshoot the causes of latency, data errors, poor connectivity, and other ERP software performance issues.

Device tree view of the complete monitoring setup

Custom PRTG dashboard for keeping an eye on the entire IT infrastructure

Live traffic data graph in PRTG
“All-around winning
network monitor”
“The real beauty of PRTG is the endless possibilities it offers”
“PRTG Network Monitor
is very hard to beat”
A slight drop in the performance of your ERP system can cause a tremendous loss of revenue, especially if it’s not resolved in time. High-performing ERP software means a high-performing business – and PRTG helps to keep your ERP implementation performant.
The database is perhaps the most crucial component of the ERP system since it contains all business-critical data. This is where PRTG has got you thoroughly covered.
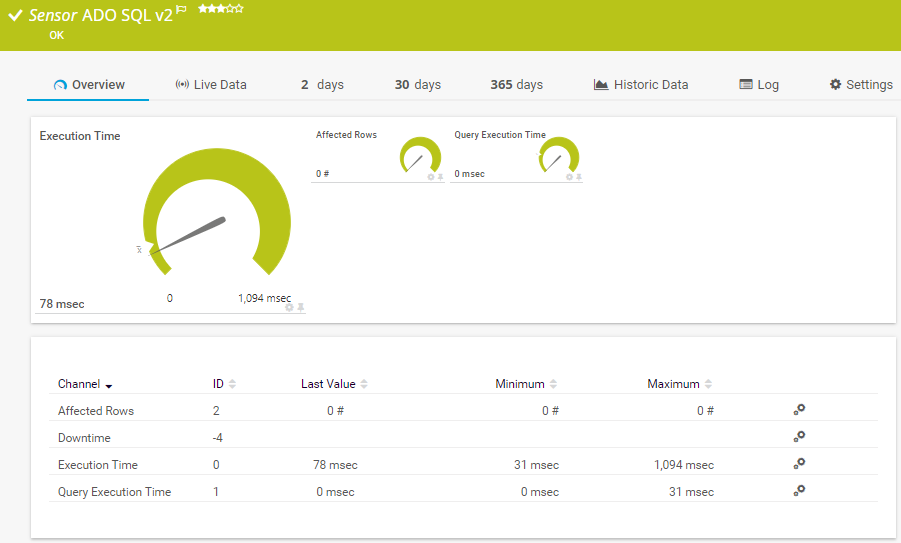
It offers preconfigured sensors for commonly used databases (MS SQL, MySQL, Oracle, PostgreSQL) out-of-the-box. If your ERP system runs a native database, you can also use PRTG’s custom ADO SQL v2 sensor or the EXE/Script Advanced sensor.
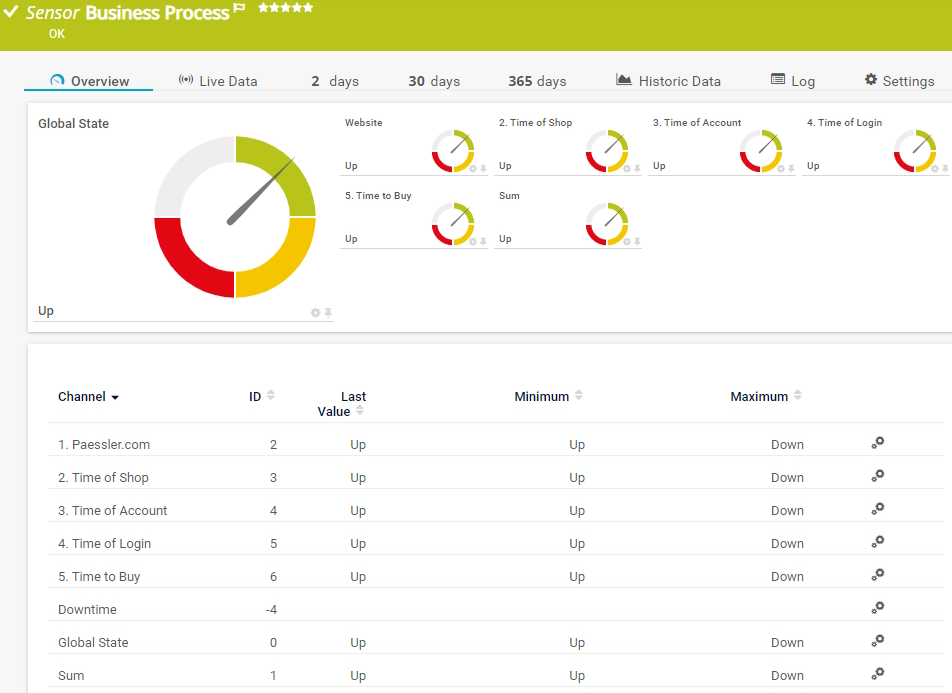
An ERP system is responsible for the smooth running of business processes, which makes them crucial to monitor. With the Business Process sensor of PRTG, you can get an overview of your whole ERP system.
The sensor consolidates monitoring data from the different applications, processes, devices etc. that you add to it. And if there’s a problem, PRTG alerts you in time so that you can remediate the issue.
In case of an outage, it’s important to determine the exact cause and location of the problem, whether your ERP system is running in the cloud as SaaS or on-premises. To do that, you need to make sure that the server your database relies on has sufficient resources.
This means you need to monitor all the physical and virtual servers involved, as well as networking devices like firewalls, routers, and switches.
Ensure peak performance and uninterrupted availability to ensure you meet your company’s SLAs. You can monitor the KPIs that are crucial for your ERP modules, such as the events and tasks running on the underlying system and information about the according business processes.
View these KPIs on a dashboard and get an overview of all the important events in just one place. And with PRTG, you can even customize the dashboards according to your needs.
PRTG comes with more than 250 native sensor types for monitoring your entire on-premises, cloud, and hybrid cloud environment out of the box. Check out some examples below!
The Business Process sensor gives you a summarized status of entire business processes while monitoring several process components. This means that you can create a customized sensor with channels based on data from other source sensors. It can show the following:
The ADO SQL v2 sensor monitors a database via an ActiveX Data Objects (ADO) connection and it executes an SQL query. It can show the following:
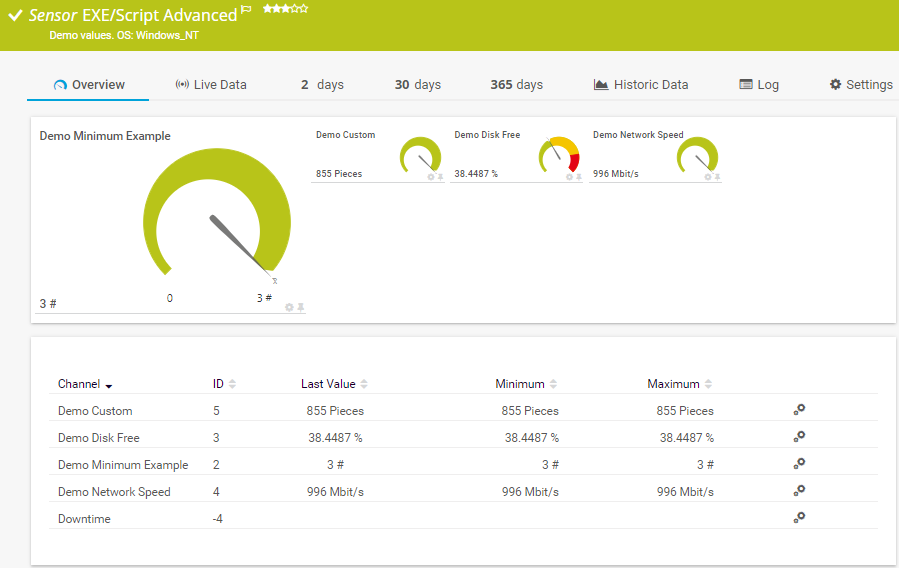
The EXE/Script Advanced sensor runs an executable file (.exe) or a script (batch file, VBScript, PowerShell) on the probe system. This option is available as part of the PRTG API. It can show the following:
See the PRTG Manual for a list of all available sensor types.

Custom alerts and data visualization let you quickly identify and prevent poor availability, slow response times, data errors, and other ERP software performance issues.
PRTG is set up in a matter of minutes and can be used on a wide variety of mobile devices.


“Excellent tool for detailed monitoring. Alarms and notifications work greatly. Equipment addition is straight forward and server initial setup is very easy. ...feel safe to purchase it if you intend to monitor a large networking landscape.”
Partnering with innovative IT vendors, Paessler unleashes synergies to create
new and additional benefits for joined customers.
Osirium’s experienced management team has an outstanding track record in cybersecurity and automation, establishing its headquarters near Reading, UK.
A combination of Orchestra and PRTG provides the ideal solution to monitor the traditional IT Infrastructure as well as the central communication server in hospitals and industrial environments.
Siemon and Paessler bring together intelligent building technology and advanced monitoring and make your vision of intelligent buildings and data centers become reality.
Real-time notifications mean faster troubleshooting so that you can act before more serious issues occur.
Network Monitoring Software – Version 25.3.110.1313 (August 27, 2025)
Download for Windows and cloud-based version PRTG Hosted Monitor available
English, German, Spanish, French, Portuguese, Dutch, Russian, Japanese, and Simplified Chinese
Network devices, bandwidth, servers, applications, virtual environments, remote systems, IoT, and more
Choose the PRTG Network Monitor subscription that's best for you


ERP – enterprise resource planning – is a type of software solution that enables organizations to manage customer relationships, finances, human resources, procurement, project management, sales, and other core business processes from one central location, creating a single source of truth that simplifies cross-functional collaboration, decision-making, and reporting. It's typically made up of several interconnected modules that share a common database. Well-known ERP solutions include Microsoft Dynamics 365, NetSuite, Oracle, and SAP Concur.
For lots of reasons. To optimize performance. To ensure your data stays accurate. To identify and address potential security threats in a proactive manner. To prevent bottlenecks and allocate resources more effectively. Should we continue?
The bottom line is that ERP software is critical to your organization's operations. Why risk its continued performance, security, and data integrity (and your organization's ability to perform core business functions) when a simple tool can help you nip issues in the bud and make sure everything keeps working as it should?
PRTG uses sophisticated sensors to track the health and performance of databases, business processes, servers, firewalls, routers, and other hardware, as well as other components that could impact your ERP software solution’s availability, response times, and overall performance. Available for Windows-based on-premises servers or as a cloud-hosted solution, it's capable of monitoring unlimited local, remote, and virtual network devices, bringing critical system data together in one simple, intuitive interface you can access from anywhere: at the office, at home, or on the go.
In PRTG, “sensors” are the basic monitoring elements. One sensor usually monitors one measured value in your network, for example the traffic of a switch port, the CPU load of a server, or the free space on a disk drive. On average, you need about 5-10 sensors per device or one sensor per switch port.
Paessler conducted trials in over 600 IT departments worldwide to tune its network monitoring software closer to the needs of sysadmins. The result of the survey: over 95% of the participants would recommend PRTG – or already have.

Paessler PRTG is used by companies of all sizes. Sysadmins love PRTG because it makes their job a whole lot easier.
Bandwidth, servers, virtual environments, websites, VoIP services – PRTG keeps an eye on your entire network.
Everyone has different monitoring needs. That’s why we let you try PRTG for free.