• Company
    • About Us
    • Case Studies
    • Press Center
    • Events
    • Careers
    • Blog
    • Contact us
  • Login
 
  • English
    • Deutsch
    • Español
    • Français
    • Italiano
    • Português
Paessler
                    - The Monitoring Experts
  • Products
    • Paessler PRTG
      Paessler PRTGMonitor your whole IT infrastructure
      • PRTG Network Monitor
      • PRTG Enterprise Monitor
      • PRTG Hosted Monitor
      • PRTG extensionsExtensions for Paessler PRTGExtend your monitoring to a new level
    • Icon Features
      FeaturesExplore all monitoring features
      • Maps & dashboards
      • Alerts & notifications
      • Multiple user interfaces
      • Distributed monitoring
      • Customizable reporting
  • Solutions
    • Industries
      IndustriesMonitor various industry sectors
      • Industrial
      • Healthcare
      • Data Center
      • Education
      • Finance
      • Government
    • IT Topics
      IT TopicsMonitor all areas of IT
      • Network Monitoring
      • Bandwidth Monitoring
      • SNMP Monitor
      • Network Mapping
      • WiFi Monitoring
      • Server Monitoring
  • Pricing
  • Resources
    • Getting Started
      Getting StartedModules for self-paced learning
    • How-to Guides
      How-to GuidesGet the most out of PRTG
    • Videos & Webinars
      Videos & WebinarsLearn from Paessler experts
    • IT  Knowledge
      IT KnowledgeExpand your IT knowledge
    • PRTG Manual
      PRTG ManualFull documentation
    • Knowledge Base
      Knowledge BaseShare community knowledge
    • PRTG Sensor Hub
      PRTG Sensor HubGet sensors, scripts & templates
    • Trainings
      PRTG TrainingLearn how to work with PRTG
  • Partners
    • icon star
      New Partners and MSPBecome a new partner or MSP
    • icon partner
      Partner PortalLog in to your partner account
    • icon search
      Find a PartnerFind partners selling Paessler products
    • icon technology
      Technology AlliancesSee Paessler technology partnerships
  • Company
    • About Us
    • Case Studies
    • Press Center
    • Events
    • Careers
    • Blog
    • Contact us
  • Login
  • English
    • Deutsch
    • Español
    • Français
    • Italiano
    • Português
  • Get a quote
  • Free trial
  1. Home>
  2. IT Topics>
  3. Virtualization>
  4. VM Management Software
PRTG Logo

VM Management with PRTG

Monitor performance metrics across virtual machines and servers to ensure optimal resource utilization

  • Detect and resolve bottlenecks in real time to minimize downtime and maintain high availability
  • Consolidate insights from hybrid cloud and on-premises environments for more efficient management
  • Connect directly with virtualization platforms and APIs to improve troubleshooting and automation
Free download
product overview

Our users give top ratings for monitoring with Paessler PRTG

Gartner peer insights
spiceworks
Capterra
G2
Trustpilot

PRTG VM management: What you will find on this page

Table of content
  • Optimize your virtual infrastructure with PRTG
  • What VM management looks like in PRTG
  • 4 reasons why PRTG is the VM management tool of your choice
  • Explore our preconfigured PRTG sensors for VM management
  • VM Management: FAQ

PRTG makes VM management as easy as it gets

Custom alerts and data visualization let you quickly identify and prevent performance issues.

Free download
PRODUCT OVERVIEW

Optimize your virtual infrastructure with PRTG

Managing virtual machines in complex environments can be challenging, especially when performance, resource allocation and uptime are critical. Paessler PRTG simplifies the monitoring of virtual machines and their infrastructure by providing actionable insights in real time. Prevent downtime, optimize resource utilization and gain peace of mind knowing that your virtual environments are running smoothly. With customizable dashboards and alerts, PRTG helps you stay ahead of potential problems and deliver reliable service.

Performance Insights

Track real-time performance metrics for CPU, memory, and storage to identify and resolve issues before they impact your business. Gain detailed insight into resource utilization to effectively optimize workloads. Clearly visualize data for faster and easier troubleshooting.

Capacity planning

Analyze resource usage trends to precisely predict future demand. Plan expansions or reallocations with confidence and avoid overprovisioning or resource shortages. Generate automated reports to share capacity requirements with stakeholders.

Proactive monitoring

Receive instant notifications when thresholds are exceeded so you can address potential problems before they escalate. Improve uptime by responding quickly to real-time alerts. Analyze historical data to identify and effectively address recurring problems.

Platform integration

Directly integrate PRTG with leading virtualization platforms such as VMware, Microsoft Hyper-V, and Nutanix to monitor your specific environment. Customize monitoring with flexible APIs to meet your needs. Achieve smooth operation across IT infrastructures with an adaptive approach.

Detailed reporting

Generate detailed reports on system performance, capacity, and usage to meet compliance and audit requirements. Customize report templates to share critical information with your team. Document compliance with SLAs and IT governance standards.

What VM management looks like in PRTG

Diagnose network issues by continuously tracking virtual machine workloads. Show latency, storage capacity, and active processes, and other key metrics in real time. Visualize monitoring data in clear graphs and dashboards to identify problems more easily. Gain the overview you need to troubleshoot resource allocation and system failures.

PRTG Screenshot device tree view

Device tree view of the complete monitoring setup

PRTG screenshot VM monitoring

Custom PRTG dashboard for keeping an eye on the VM infrastructure

PRTG screenshot graph live data traffic

Live traffic data graph in PRTG

Start monitoring your virtual infrastructure with PRTG and see how it can make your network more reliable and your job easier.

Free download
PRODUCT OVERVIEW

IT experts agree: Paessler PRTG is a great solution for IT infrastructure monitoring

PCMag

“All-around winning
 network monitor”

IT Brief

“The real beauty of PRTG is the endless possibilities it offers”

ITPro

“PRTG Network Monitor 
is very hard to beat”

4 reasons why PRTG is the VM management tool of your choice

Staying ahead in virtual environment management means having the right insights at the right time. PRTG provides you with real-time data and customizable features that adapt to your infrastructure. Whether you're managing a small data center or a global IT infrastructure, PRTG scales with your needs and empowers your team with the right tools.

Icon simple subscription

Simple subscription

Choose from flexible subscription plans based on your business size and needs. Easily upgrade or adjust your plan as your IT infrastructure evolves. Enjoy transparent pricing with no hidden fees so you can budget with confidence..

Icon reliable support

Reliable support

Get expert help whenever you need it from our experienced support team. Benefit from clear, detailed documentation and an active user community. Rely on technical expertise to quickly resolve any challenges you might face.

Icon dashboards

Customizable dashboards

Create dashboards that display the metrics and data that matter most to you. Customize your view with widgets and graphs to monitor your virtual environment at a glance. Simplify decision-making by presenting data in a way that fits your workflow.

Icon scalable architecture

Scalable architecture

Use PRTG to monitor everything from small setups to large IT infrastructures. Easily scale monitoring as your virtual environments grow. Keep performance and efficiency consistent as your business and workloads expand.

Explore our preconfigured PRTG sensors for VM management

PRTG comes with more than 250 native sensor types for monitoring your entire on-premises, cloud, and hybrid cloud environment out of the box. Check out some examples below!

Hyper-V Virtual Machine

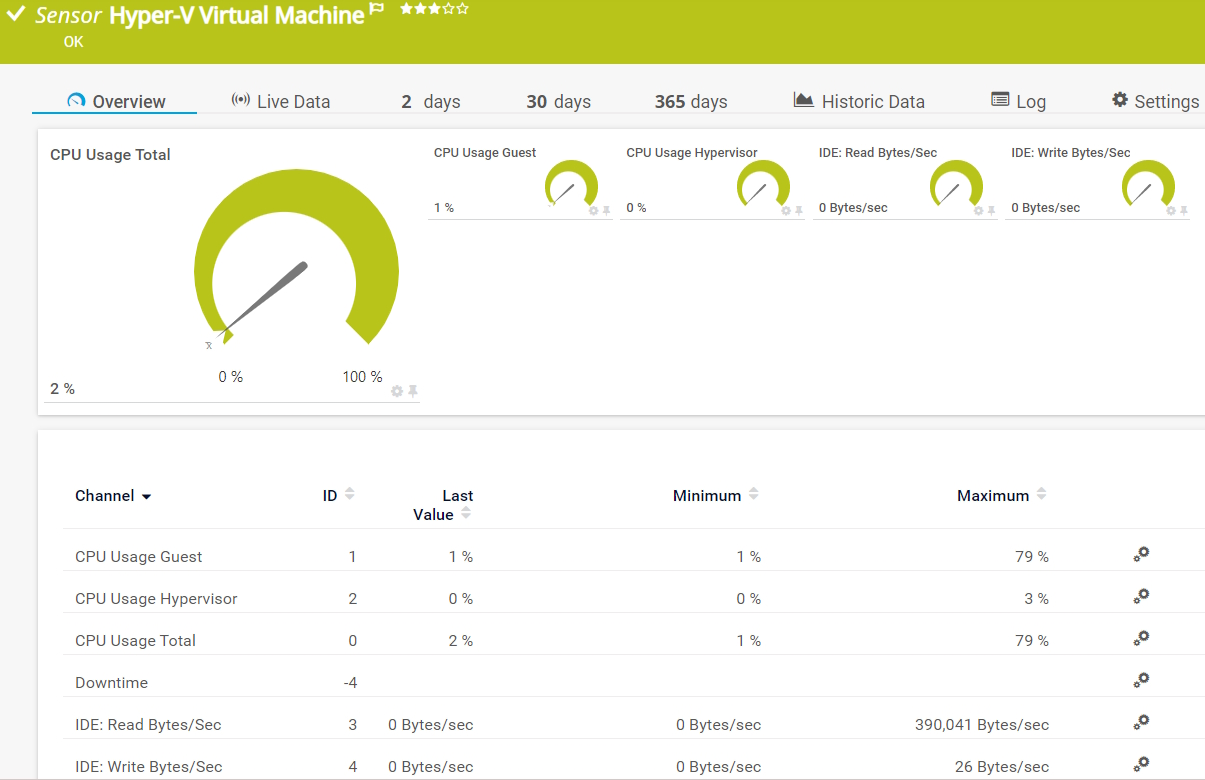
The Hyper-V Virtual Machine sensor monitors a virtual machine that runs on a Microsoft Hyper-V host server via WMI or Windows performance counters. It can show the following:

  • CPU usage of the hypervisor, the guests, and in total
  • Disk read and write speed of the IDE
Hyper-V Virtual Machine

Hyper-V Virtual Storage Device

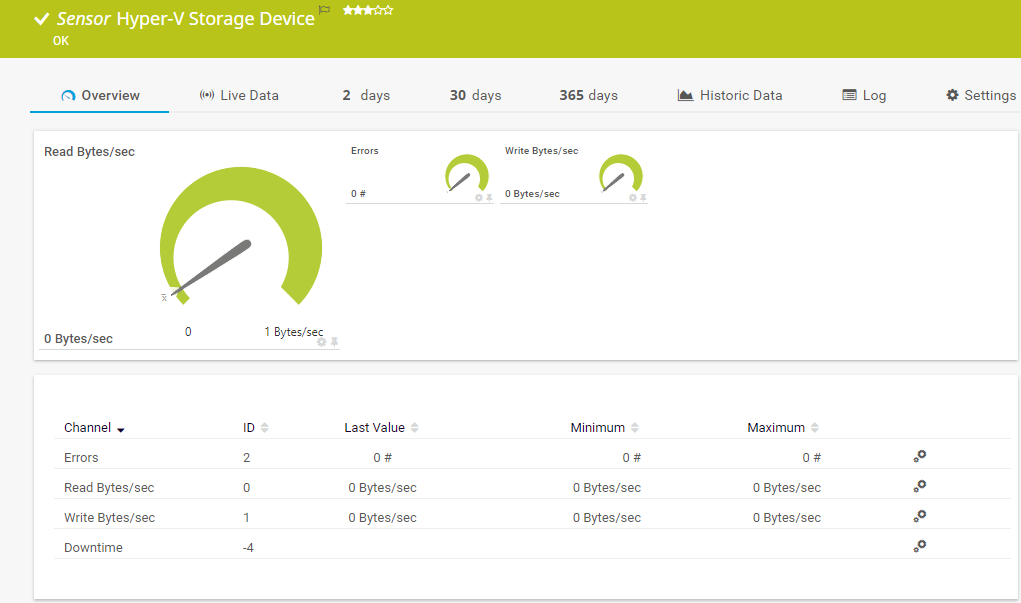
The Hyper-V Virtual Storage Device sensor monitors a virtual storage device that runs on a Microsoft Hyper-V host server via WMI or Windows performance counters. It can show the following:

  • Number of errors
  • Read and write speed
Hyper-V Virtual Storage Device

VMware Host Hardware Status (SOAP)

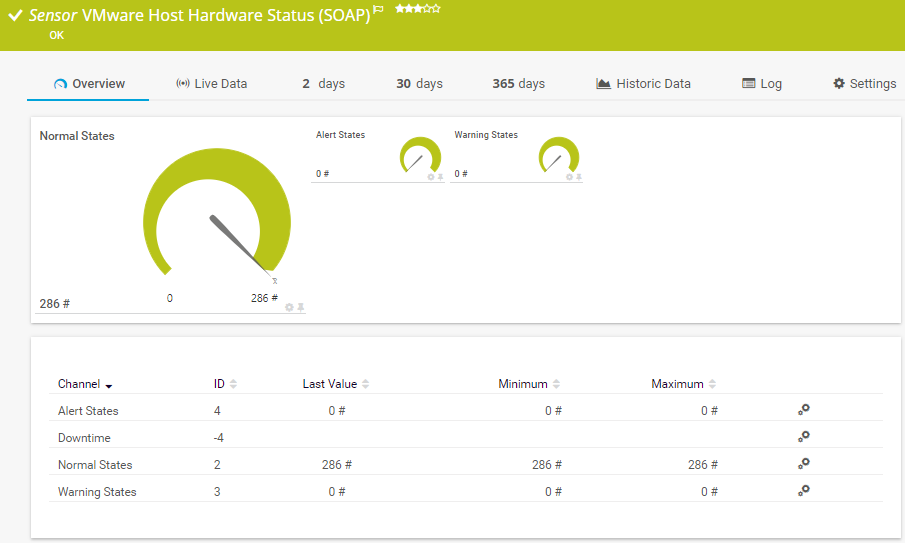
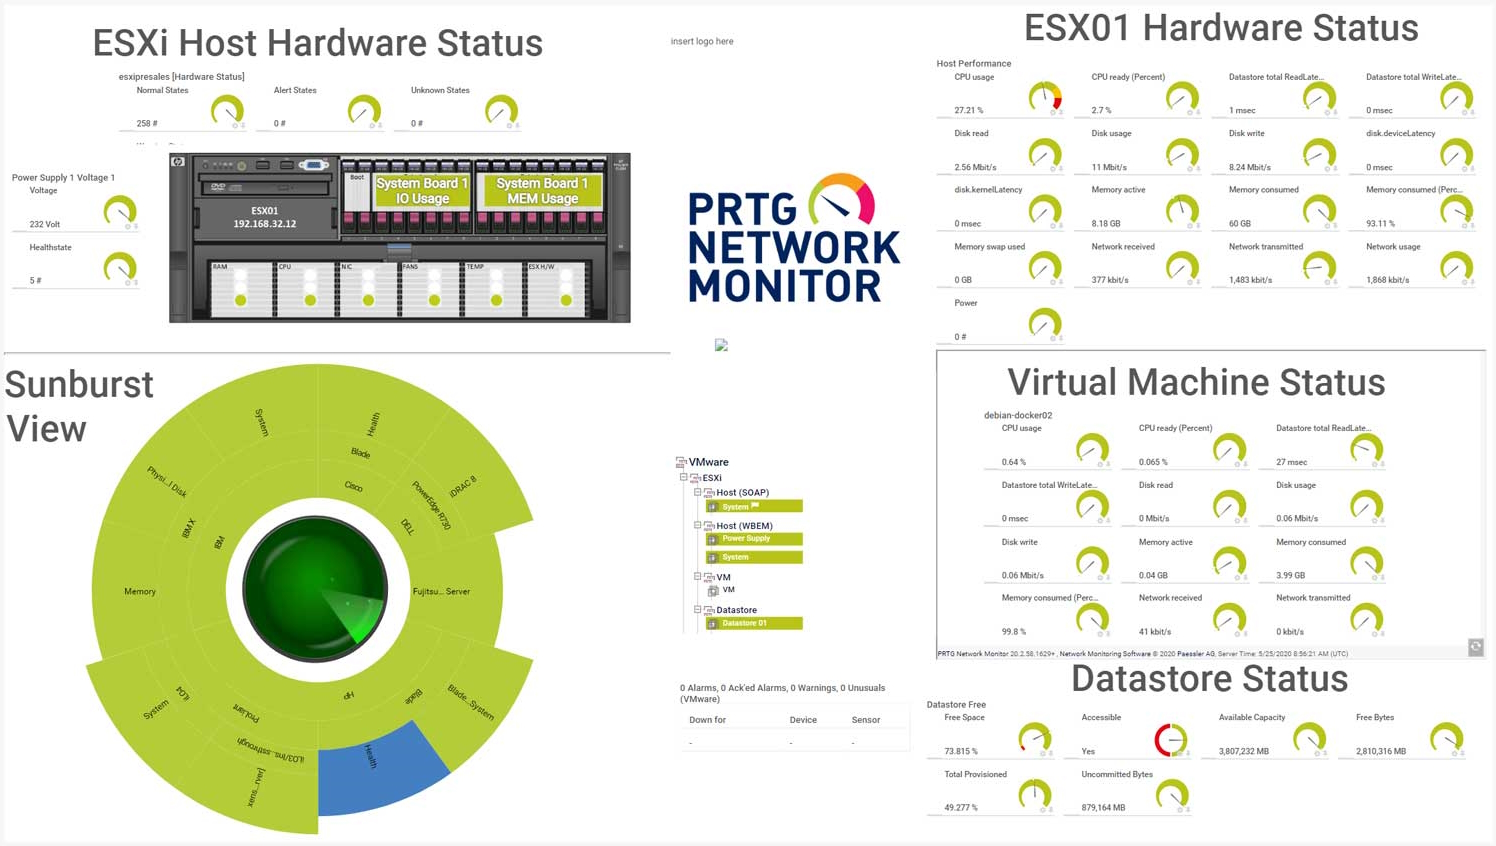
The VMware Host Hardware Status (SOAP) sensor monitors the hardware status of a VMware host server using the Simple Object Access Protocol (SOAP). It gives you a general status overview of the host. It can show the following:

  • Downtime
  • Total number of items in the alert, warning, normal, and unknown status as the vSphere client reports
VMware Host Hardware Status (SOAP)

VMware Datastore (SOAP)

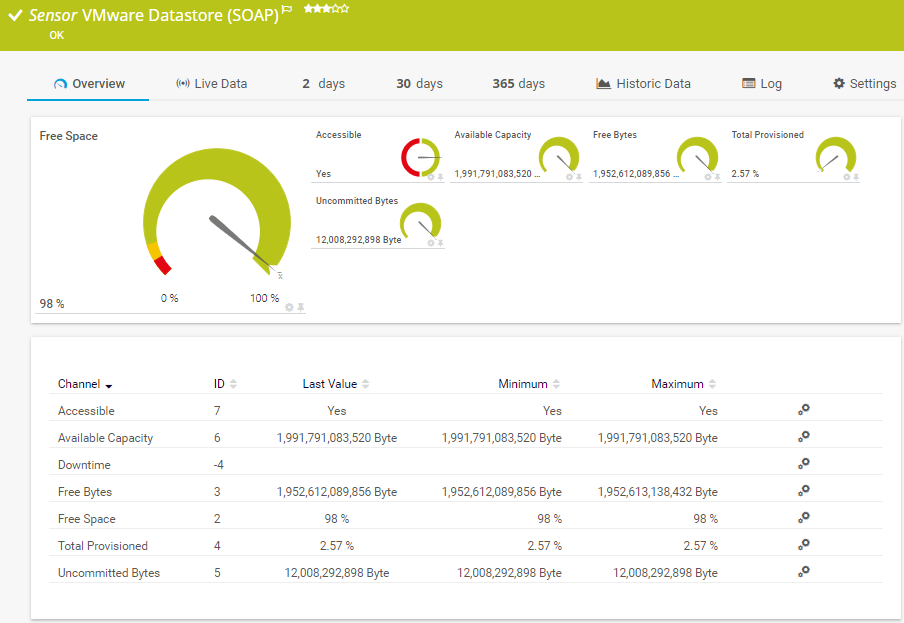
The VMware Datastore (SOAP) sensor monitors the disk usage of a VMware datastore using the Simple Object Access Protocol (SOAP). It can show the following:

  • Accessibility of the datastore
  • Available capacity
  • Free and total provisioned disk space
  • Uncommitted bytes
VMware Datastore (SOAP)

Microsoft Azure Virtual Machine

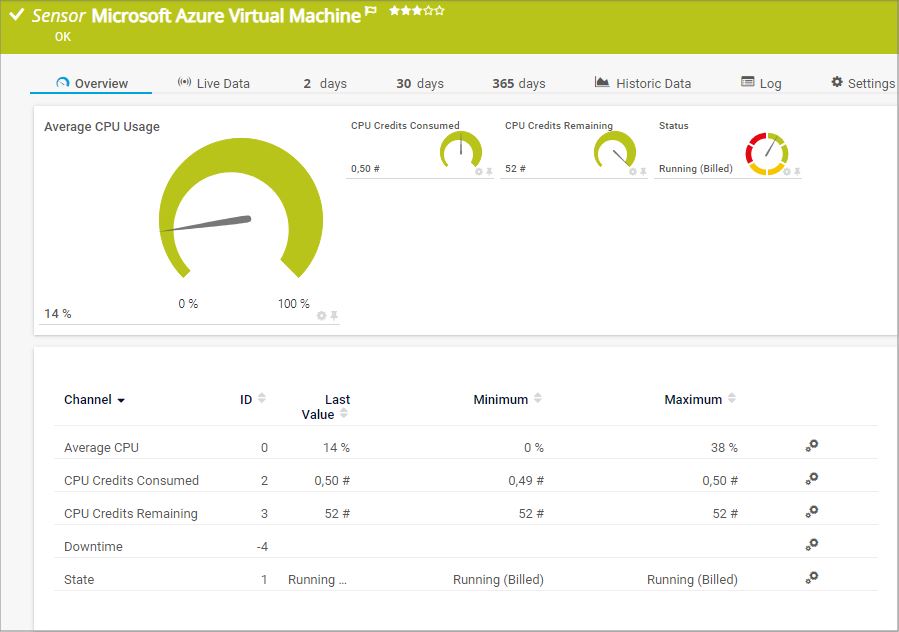
The Microsoft Azure Virtual Machine sensor monitors the status of a virtual machine (VM) in a Microsoft Azure subscription. It can show the following:

  • Average CPU load
  • Number of consumed CPU credits
  • Number of remaining CPU credits
  • VM status
Microsoft Azure Virtual Machine

Citrix XenServer Virtual Machine

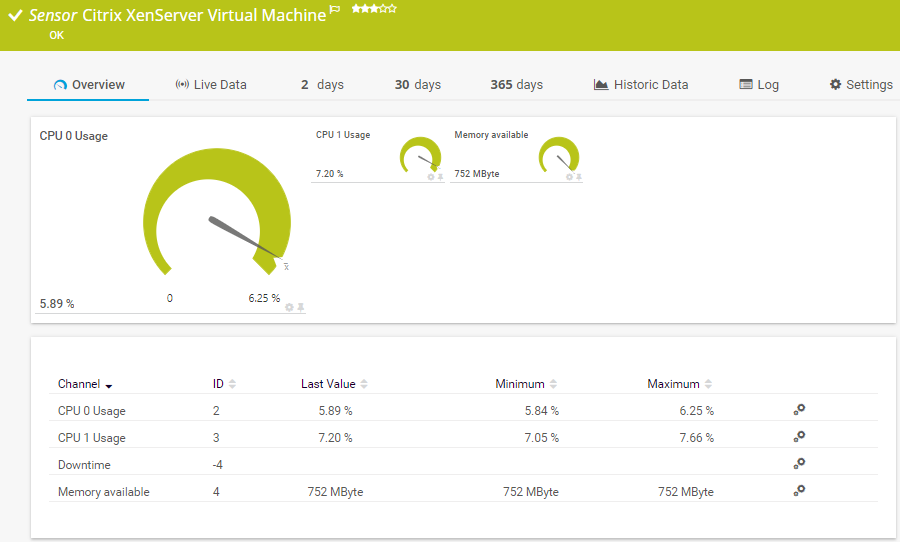
The Citrix XenServer Virtual Machine sensor monitors a virtual machine (VM) on a XenServer via HTTP. It can show the following:

  • CPU usage
  • Available and used memory
  • Balloon driver target size
Citrix XenServer Virtual Machine

See the PRTG Manual for a list of all available sensor types.

PRTG is compatible with all major vendors, products, and systems

compatible with all major vendors, products, and systems

PRTG makes VM management as easy as it gets

Custom alerts and data visualization let you quickly identify and prevent performance issues.

Free download
PRODUCT OVERVIEW

“With PRTG, you get a centralized, intuitive, all-in-one tool that monitors the entire infrastructure. In the event of an error, the software immediately informs you by email. If you don’t hear from PRTG, you can sit back and relax, knowing everything is in order. Shortly after implementing PRTG, we were able to identify and eliminate performance bottlenecks in our VMware environment and load problems in our network.”

Steffen Ille, Head of Infrastructure, Service Center for Computer Systems and Communication
Bauhaus University Weimar

“The demands on our entire IT infrastructure have grown steadily in recent years. An important step towards the optimization of this environment involved the virtualization of our digital landscape. In order to maintain the required transparency and the uninterrupted performance of all our systems, we needed a powerful network monitoring tool. For us, the most important selection criteria were price-performance ratio and ease of use. PRTG met all our expectations and has proven to be an indispensable part of our network management.”

Daniel Baumgartner, Network Administrator
Volkswind

Your VM management monitor at a glance – even on the go

PRTG is set up in a matter of minutes and can be used on a wide variety of mobile devices.

device overview
vmware

We are a VMware Technology Alliance Partner

Paessler achieved VMware's highest level of endorsement due to our technological excellence, leading market position, and superior compatibility with VMware products.

What does this mean for you?

  • Easy integration of VMware components with PRTG
  • State-of-the-art features for monitoring your virtual environment
  • Expert technical support around your VMware monitoring setup

Create innovative solutions with Paessler’s IT partners

Partnering with innovative IT vendors, Paessler unleashes synergies to create
new and additional benefits for joined customers.

Rittal

Rittal

IT that works constitutes a business-critical basis for a company's success. Availability and security must be defined for the respective purpose and closely monitored – by OT and IT alike.

Read more
baramundi

baramundi

baramundi and PRTG create a secure, reliable and powerful IT infrastructure where you have everything under control - from the traffic in your firewall to the configuration of your clients.

Read more
INSYS icom

INSYS icom

With the combination of PRTG and Insys, the monitoring specialist Paessler and the industrial gateway manufacturer INSYS icom offer a practical possibility to merge IT and OT.

Read more

Find the root cause of the problem with our PRTG VM management solution

Real-time notifications mean faster troubleshooting so that you can act before more serious issues occur.

Free download
PRODUCT OVERVIEW
Paessler PRTG

Paessler PRTG

Network Monitoring Software – Version 24.4.102.1351 (November 12th, 2024)

Hosting icon

Hosting

Download for Windows and cloud-based version PRTG Hosted Monitor available

Languages icon

Languages

English, German, Spanish, French, Portuguese, Dutch, Russian, Japanese, and Simplified Chinese

test

Monitor everything

Network devices, bandwidth, servers, applications, virtual environments, remote systems, IoT, and more

test

Pricing

Choose the PRTG Network Monitor subscription that's best for you

VM Management: FAQ


What is a virtual machine software management tool?

A VM software management tool helps IT teams control and monitor virtual environments to optimize performance, resource allocation and security. It typically works with virtualization technologies such as VMware vSphere, Microsoft Hyper-V and open source solutions to efficiently manage virtual servers, virtual networks and the underlying hypervisor.

How does PRTG support virtual machine monitoring?

PRTG monitors virtual servers and their performance metrics, helping you track resource usage such as CPU, memory, and disk. By integrating with hypervisors and virtualization management software, it provides real-time data for performance monitoring, optimization, and troubleshooting. This helps IT teams to detect vulnerabilities and keep high availability across their cloud infrastructure or on-premises systems.

Can PRTG help with disaster recovery planning?

Yes, PRTG plays a significant role in disaster recovery planning by continuously monitoring your virtual servers and networks for potential problems. It tracks system health, detects bottlenecks and makes sure that data replication processes are running smoothly. By identifying vulnerabilities early, PRTG helps you prepare for and respond to outages, ensuring uptime and fast recovery in critical situations.

Does PRTG work with different operating systems?

PRTG is compatible with a wide range of operating systems, including Windows and Linux. This makes it a versatile monitoring tool that can adapt to diverse IT infrastructures. Whether you are using physical servers, virtual servers, or hybrid environments, PRTG ensures consistent monitoring and optimization across all platforms.

How does PRTG integrate with virtualization technologies?

PRTG supports leading virtualization technologies like VMware vSphere, Microsoft Hyper-V, and Nutanix. It can connect to tools like vCenter and use APIs for deeper insights into your virtual infrastructure. This native integration enables IT teams to monitor live migrations, optimize resource allocation, and support scalability in growing environments.

Is PRTG suitable for hybrid and cloud environments?

Yes, PRTG is ideal for monitoring hybrid cloud setups and cloud infrastructure provided by AWS and other providers. It tracks resource utilization across both on-premises systems and cloud platforms, offering insights into consolidation and scalability. This functionality makes it a cost-effective solution for organizations transitioning to or operating hybrid IT infrastructures.

How does PRTG simplify monitoring for IT teams?

PRTG simplifies monitoring with customizable dashboards, intuitive setup, and automated alerts. It consolidates data from physical servers, virtual servers, and cloud environments into a single pane of glass. This centralized view helps IT teams save time, focus on optimization, and improve decision-making for their virtual infrastructure.

What is a sensor in PRTG?

In PRTG, “sensors” are the basic monitoring elements. One sensor usually monitors one measured value in your network, for example the traffic of a switch port, the CPU load of a server, or the free space on a disk drive. On average, you need about 5-10 sensors per device or one sensor per switch port.

We asked: would you recommend PRTG? Over 95% of our customers say yes!

Paessler conducted trials in over 600 IT departments worldwide to tune its network monitoring software closer to the needs of sysadmins. The result of the survey: over 95% of the participants would recommend PRTG – or already have.

recommendation

Still not convinced?

Love

More than 500,000 sysadmins love PRTG

Paessler PRTG is used by companies of all sizes. Sysadmins love PRTG because it makes their job a whole lot easier.

PRTG

Monitor your entire IT infrastructure

Bandwidth, servers, virtual environments, websites, VoIP services – PRTG keeps an eye on your entire network.

test

Try Paessler PRTG for free

Everyone has different monitoring needs. That’s why we let you try PRTG for free.

PRTG Logo

Start monitoring your VM infrastructure with PRTG and see how it can make your network more reliable and your job easier.

Free download
PRODUCT OVERVIEW

Products

  • Paessler PRTG
    Paessler PRTGMonitor your whole IT infrastructure
    • PRTG Network Monitor
    • PRTG Enterprise Monitor
    • PRTG Hosted Monitor
    • PRTG extensions
      Extensions for Paessler PRTGExtend your monitoring to a new level
  • Icon Features
    FeaturesExplore all monitoring features

Monitoring with PRTG

  • Network monitoring
  • Bandwidth monitoring
  • SNMP monitoring
  • Network mapping
  • Wi-Fi monitoring
  • Server monitoring
  • Network traffic analyzer
  • NetFlow monitoring
  • Syslog server

Useful Links

  • PRTG Manual
  • Knowledge Base
  • Customer Success Stories
  • About Paessler
  • Subscribe to newsletter
  • PRTG Support
  • PRTG Consulting

Contact

Paessler GmbH
Thurn-und-Taxis-Str. 14, 
90411 Nuremberg 
Germany

info@paessler.com

+49 911 93775-0

  • Contact us
©2025 Paessler GmbHTerms & ConditionsPrivacy PolicyImprintReport VulnerabilityDownload & InstallSitemap
404 - Page not found 404 - Page not found 404 - Page not found