Custom alerts and data visualization let you quickly identify and prevent Nutanix performance issues.
Hyperconverged infrastructure (HCI) is extremely complex. If just one of its components malfunctions, the entire system can become paralyzed and the hyperconverged environment can go offline.
But how do you keep an eye on such versatile virtual infrastructure?
Paessler PRTG can monitor your entire Nutanix HCI, including virtual storage, computer, and network units. Use our all-in-one network monitoring software to also ensure the optimal performance of your Nutanix environment.

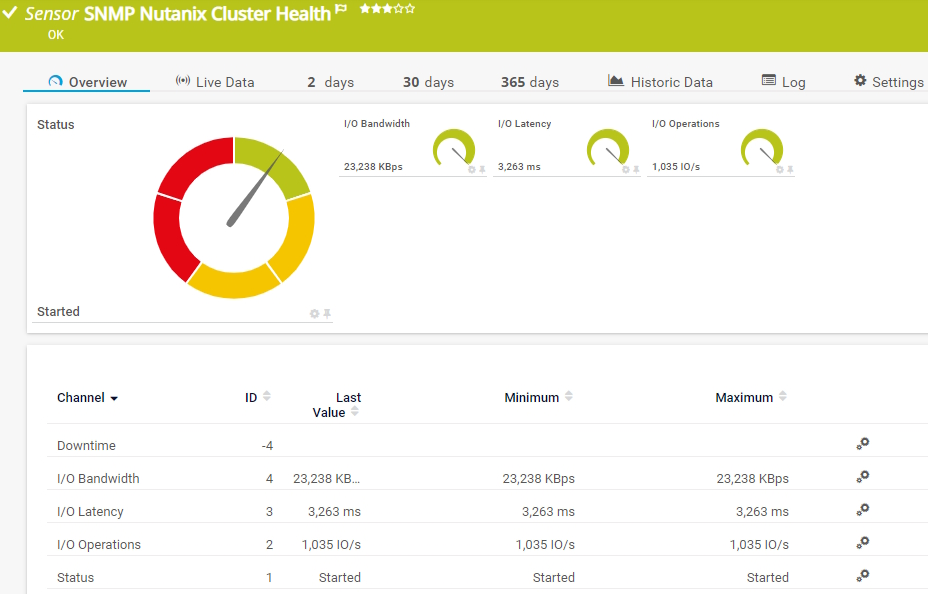
In HCI environments, storage components are usually responsible for the biggest drops in performance. That’s why PRTG also constantly checks the IOPs performance data of your Nutanix clusters, including bandwidth and latency, as well as the number of I/O commands per second.
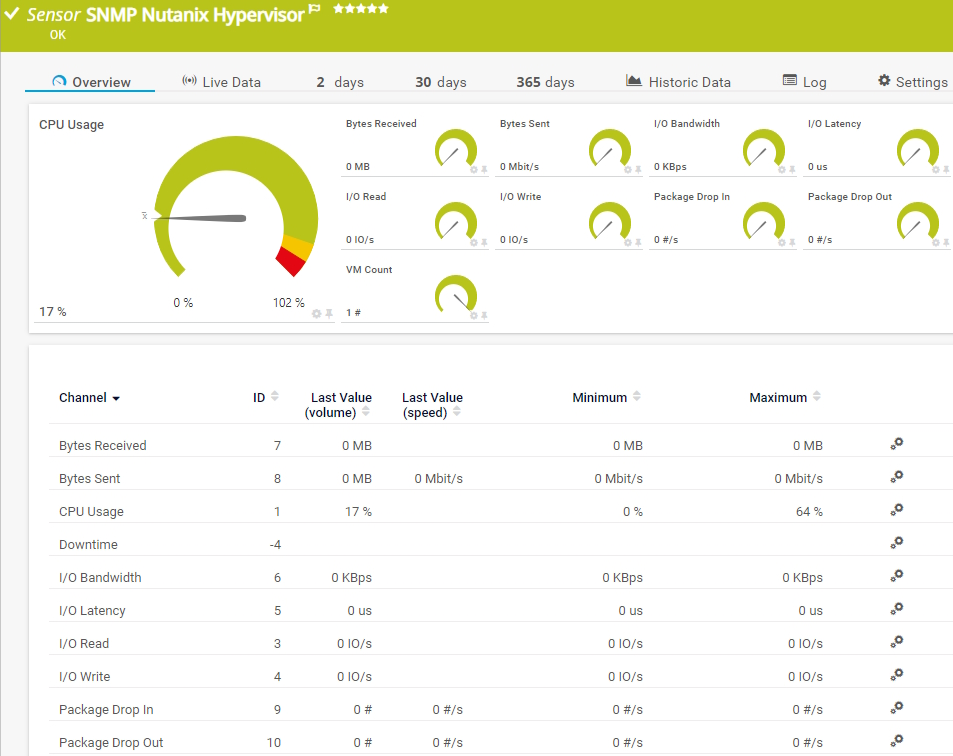
Of course, your Nutanix hypervisors also play an important role when analyzing HCI performance data. With PRTG, you can constantly track parameters such as the processor load, individual I/O performance data, packet loss, and the number of active virtual machines (VMs).
Diagnose network issues by continuously tracking the status and performance of your Nutanix HCI. Show response time, bandwidth usage, latency, packet loss, CPU usage, virtual machine count, and other key metrics in real time. Visualize monitoring data in clear graphs and dashboards to identify problems more easily. Gain the overview you need to troubleshoot issues with your Nutanix clusters and hypervisors.

Device tree view of the complete monitoring setup

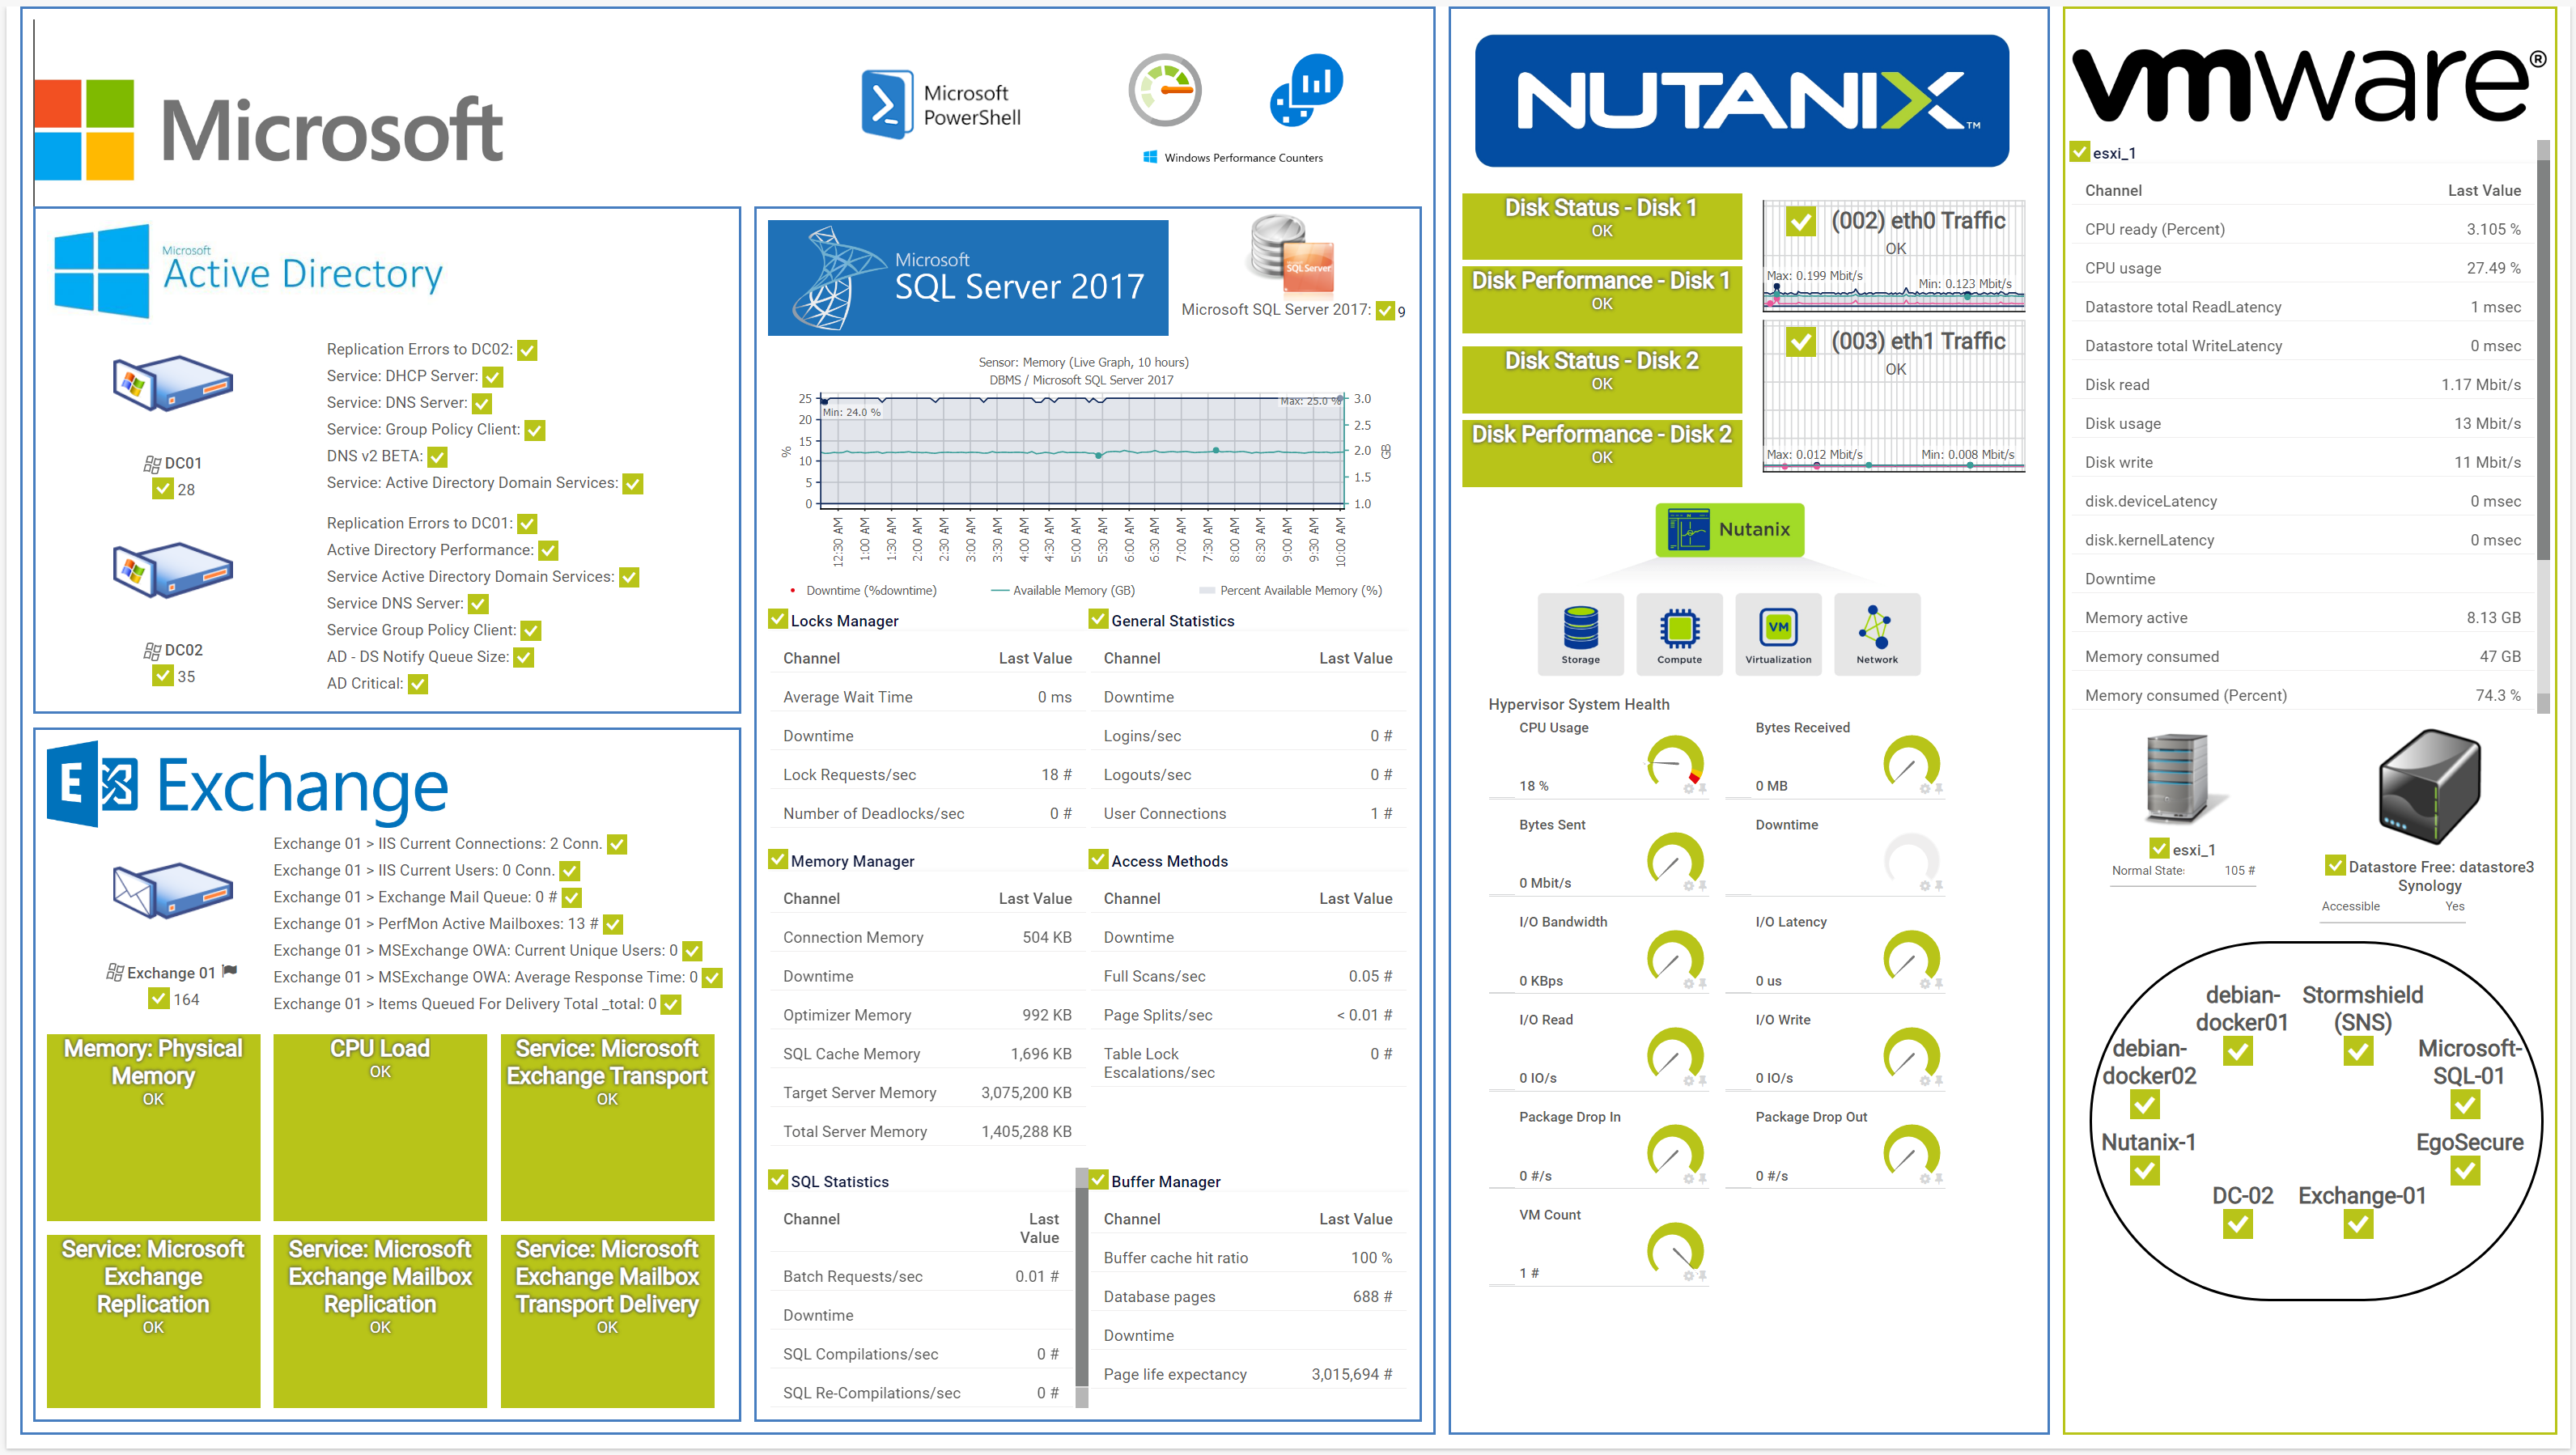
Custom PRTG dashboard for keeping an eye on the entire IT infrastructure

Live traffic data graph in PRTG
“All-around winning
network monitor”
“The real beauty of PRTG is the endless possibilities it offers”
“PRTG Network Monitor
is very hard to beat”
PRTG monitors your complete IT infrastructure – no matter if you have an on-premises Windows or Linux, cloud, or hyperconverged environment. Watch Nutanix cluster performance alongside everything else: every PRTG subscription includes all monitoring features.
Sit back, relax, and let PRTG do the monitoring and alerting for you. If there is an issue with your Nutanix resources or any other problem in your network, PRTG alerts you immediately via email, SMS, push notification, and other methods – always based on your individual threshold values.
Gone are the days where you have to manually check the status of every Nutanix component. PRTG provides you with a central overview in an easy-to-read dashboard. Or create your own, customized maps and dashboards that show your Nutanix monitoring metrics the way you want.
PRTG comes with more than 250 native sensor types for monitoring your entire on-premises, cloud, and hybrid cloud environment out of the box. Check out some examples below!
The SNMP Nutanix Hypervisor sensor monitors a Nutanix hypervisor. It can show the following:
The SNMP Nutanix Cluster Health sensor monitors the status and the performance of a Nutanix cluster. It can show the following:
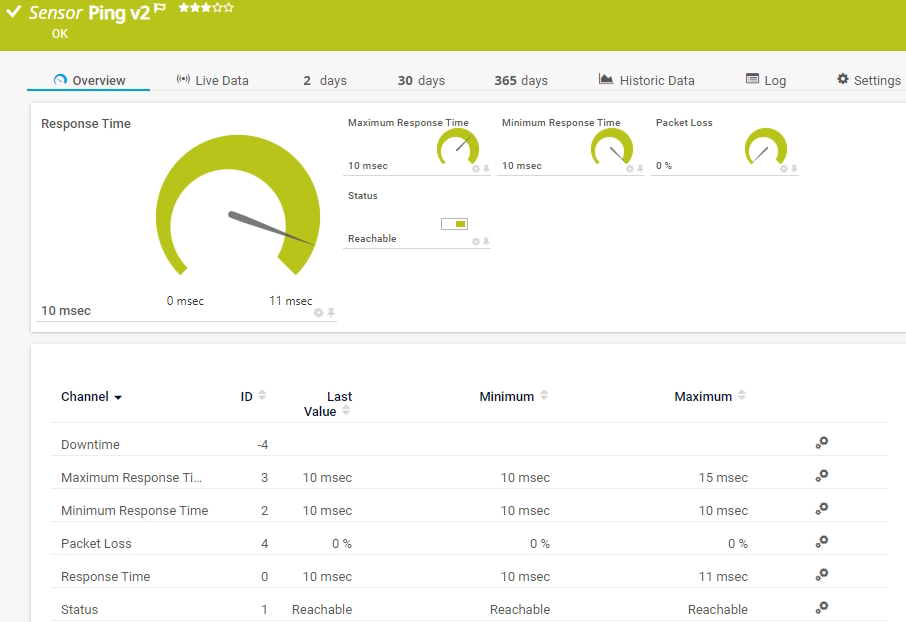
The Ping v2 sensor sends an Internet Control Message Protocol (ICMP) echo request ("ping") from the probe system to the parent device to monitor its availability. It can show the following:
• Response time
• Packet loss
• Target status
• Minimum and maximum ping time
See the PRTG Manual for a list of all available sensor types.

Custom alerts and data visualization let you quickly identify and prevent Nutanix performance issues.
PRTG is set up in a matter of minutes and can be used on a wide variety of mobile devices.


“Excellent tool for detailed monitoring. Alarms and notifications work greatly. Equipment addition is straight forward and server initial setup is very easy. ...feel safe to purchase it if you intend to monitor a large networking landscape.”
Partnering with innovative IT vendors, Paessler unleashes synergies to create
new and additional benefits for joined customers.
Integrating monitoring results from PRTG into NetBrain maps makes the foundation for network automation.
Combining PRTG’s broad monitoring feature set with IP Fabric’s automated network assurance creates a new level of network visibility and reliability.
Combining their tools to a powerful solution for advanced analysis and automation, KnowledgeRiver and Paessler enable IT teams to ensure best performance for their infrastructure and networks.
Real-time notifications mean faster troubleshooting so that you can act before more serious issues occur.
Network Monitoring Software – Version 25.3.110.1313 (August 27, 2025)
Download for Windows and cloud-based version PRTG Hosted Monitor available
English, German, Spanish, French, Portuguese, Dutch, Russian, Japanese, and Simplified Chinese
Network devices, bandwidth, servers, applications, virtual environments, remote systems, IoT, and more
Choose the PRTG Network Monitor subscription that's best for you


Nutanix is an enterprise cloud computing company that provides a software-defined platform designed to modernize data centers and simplify IT infrastructure management. Nutanix pioneered the concept of hyper-converged infrastructure (HCI). Nutanix’s HCI platform integrates compute (CPU and memory), storage, and virtualization into a single appliance or software layer, making it easier for businesses to manage and scale. Nutanix runs on its proprietary Acropolis Operating System (AOS) and developed its own native hypervisor, called AHV. Nutanix-native tools for monitoring and management include Nutanix Prism Element and Prism Central.
Hyperconverged infrastructure (HCI) is mainly used in large data centers and multi/hybrid cloud environments. It allows for existing hardware and software to be converged into a single system that can be managed with appropriate tools. New digital workplaces can therefore be set up more quickly and existing resources used more efficiently.
Monitoring Nutanix infrastructure provides numerous benefits that enhance the performance, efficiency, and overall management of the IT environment. Here are the key benefits of monitoring Nutanix:
PRTG comes with preconfigured Nutanix sensors for monitoring Nutanix clusters and hypervisors. These sensors pull data via SNMP (Simple Network Management Protocol), which must be properly configured in the Nutanix environment. Nutanix only supports SNMP v3.
In PRTG, “sensors” are the basic monitoring elements. One sensor usually monitors one measured value in your network, for example the traffic of a switch port, the CPU load of a server, or the free space on a disk drive. On average, you need about 5-10 sensors per device or one sensor per switch port.
Paessler conducted trials in over 600 IT departments worldwide to tune its network monitoring software closer to the needs of sysadmins. The result of the survey: over 95% of the participants would recommend PRTG – or already have.

Paessler PRTG is used by companies of all sizes. Sysadmins love PRTG because it makes their job a whole lot easier.
Bandwidth, servers, virtual environments, websites, VoIP services – PRTG keeps an eye on your entire network.
Everyone has different monitoring needs. That’s why we let you try PRTG for free.