Custom alerts and data visualization let you quickly identify and prevent performance issues with your virtual machines.
Are you struggling to maintain visibility into your Azure virtual machine environment? Our Azure VM monitoring solution provides immediate insight into the health, performance, and costs of your cloud infrastructure. This allows you to prevent downtime and optimize resources before issues impact your business.
Monitor your entire Azure VM infrastructure alongside on-premises systems from one centralized dashboard. PRTG eliminates the need to switch between multiple monitoring tools by providing comprehensive visibility into your hybrid environment. You can track critical metrics for all your Azure VMs and correlate them with other infrastructure components for complete context.
Receive immediate alerts when your Azure VMs experience performance issues or availability problems. PRTG allows you to set custom thresholds for CPU, memory, disk space, and network metrics to catch problems early. You can configure notifications to be delivered via email, SMS, push notifications, or integrate with your preferred communication platforms.
Deploy Azure monitoring in minutes with ready-to-use sensors specifically designed for Microsoft Azure VMs. PRTG includes templates for virtual machines, storage accounts, SQL databases, and subscription costs right out of the box. You can start monitoring immediately without complex configuration or scripting requirements.
Generate detailed reporting on Azure VM performance, availability, and resource utilization with just a few clicks. PRTG enables you to create scheduled reports for stakeholders or on-demand analysis when troubleshooting issues. You can customize visualizations to focus on the metrics that matter most to your organization.
Diagnose network issues by continuously tracking the health of your virtual machines, storage performance and CPU utilization. Show resource consumption and other key metrics in real time. Visualize monitoring data in clear graphs and dashboards to identify problems more easily. Gain the overview you need to troubleshoot cloud infrastructure problems and application dependencies.
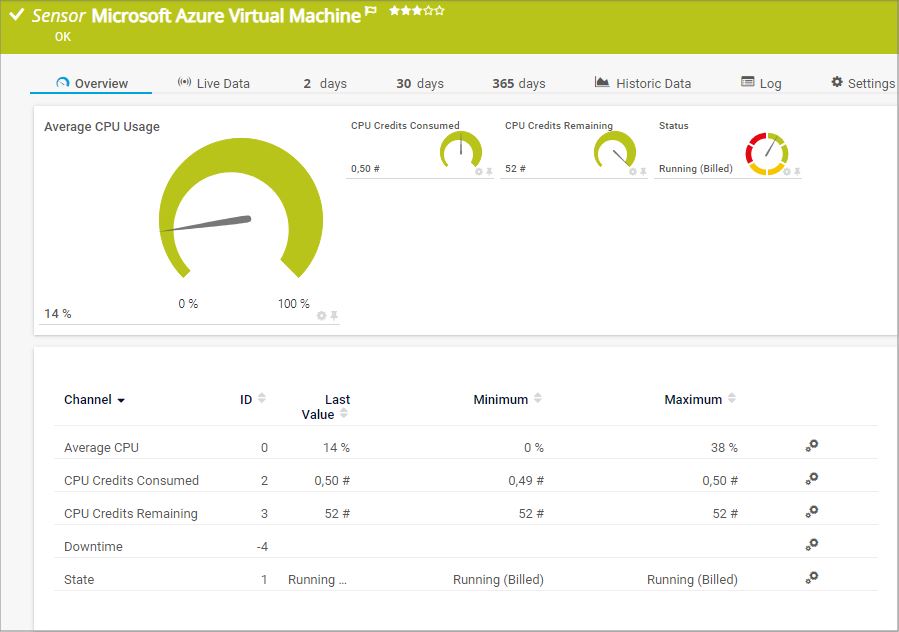
PRTG Sensor Monitoring – Microsoft Azure VM CPU Performance at a glance

Custom PRTG dashboard for keeping an eye on the entire IT infrastructure

Device tree view of the complete monitoring setup

Live traffic data graph in PRTG
“All-around winning
network monitor”
“The real beauty of PRTG is the endless possibilities it offers”
“PRTG Network Monitor
is very hard to beat”
As your cloud footprint grows, managing Azure virtual machines can quickly become overwhelming. Unexpected performance degradation, resource constraints, and escalating costs can catch you off guard. Troubleshooting across disconnected monitoring tools also wastes precious time. Without proper visibility, critical issues may go unnoticed until users start complaining.
Choose a monitoring package that fits your current infrastructure size perfectly without overpaying. As your Azure environment grows or changes, adjust your subscription with options ranging from 500 to 10,000 sensors. Start small and scale up whenever you need to, without the hassle of complicated licensing negotiations.
In minutes, connect PRTG to your Azure environment with straightforward configuration wizards that guide you through each step. Deploy preconfigured sensor templates that automatically detect the most important metrics for your virtual machines. Customize your monitoring dashboard with drag-and-drop simplicity to focus on what matters most.
Get expert help whenever you run into problems with your Azure VM monitoring setup. Take advantage of comprehensive documentation, active user forums, and direct support from monitoring specialists who are familiar with cloud environments. Get personalized help to resolve issues quickly instead of relying on generic troubleshooting guides.
Analyze performance trends and resource utilization patterns to identify potential VM problems before they impact your operations. Schedule automated maintenance actions based on specific threshold triggers to prevent downtime. Continuously optimize your Azure infrastructure with detailed insights into historical performance data.
PRTG comes with more than 250 native sensor types for monitoring your entire on-premises, cloud, and hybrid cloud environment out of the box. Check out some examples below!
The Microsoft Azure Virtual Machine sensor monitors the status of a virtual machine (VM) in a Microsoft Azure subscription. It can show the following:
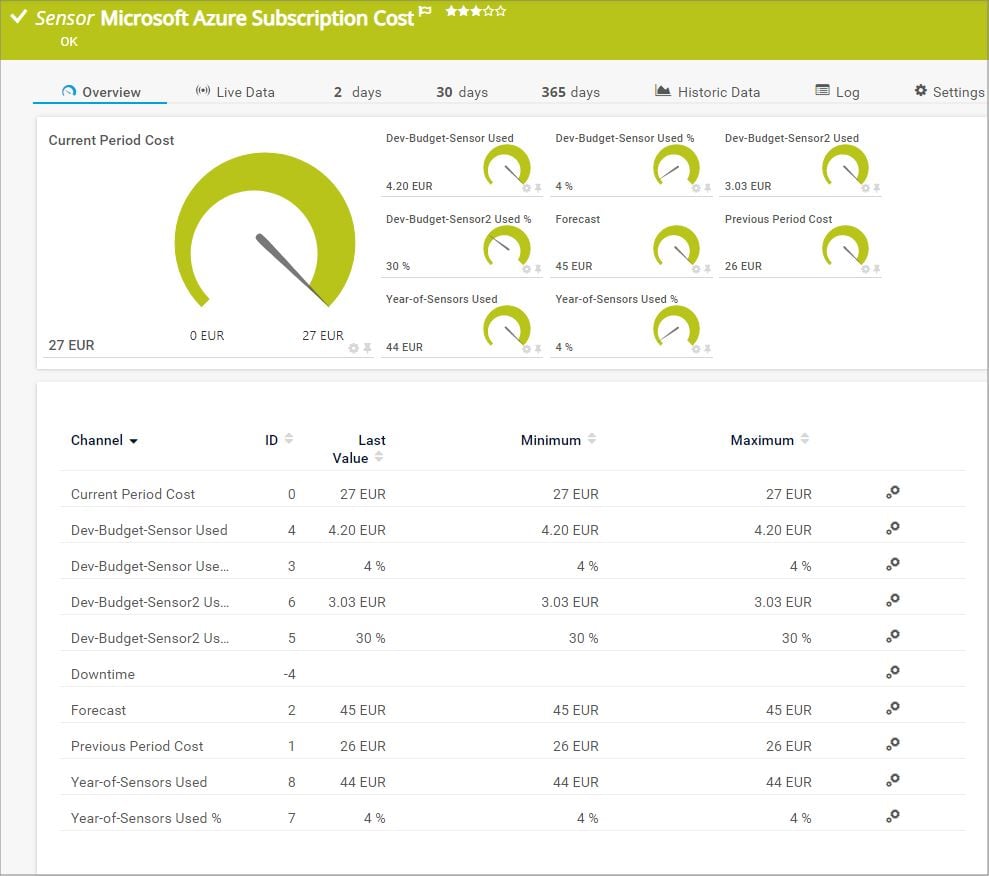
The Microsoft Azure Subscription Cost sensor monitors the cost in a Microsoft Azure subscription. It can show the following:
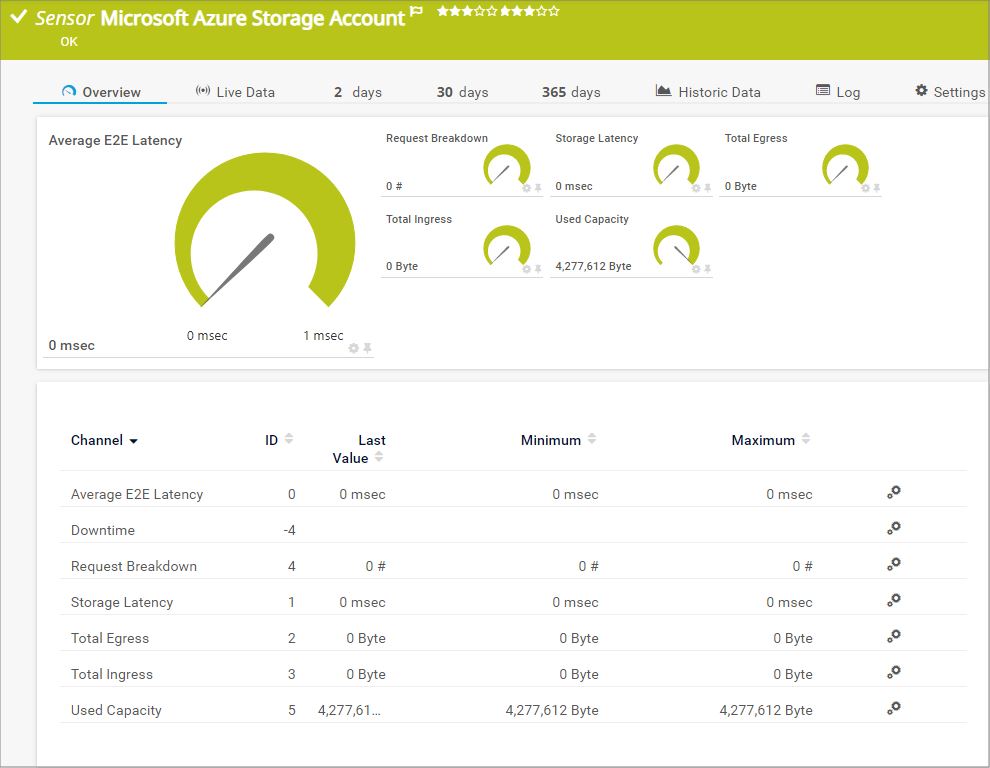
The Microsoft Azure Storage Account sensor monitors the storage account in a Microsoft Azure subscription. It can show the following:
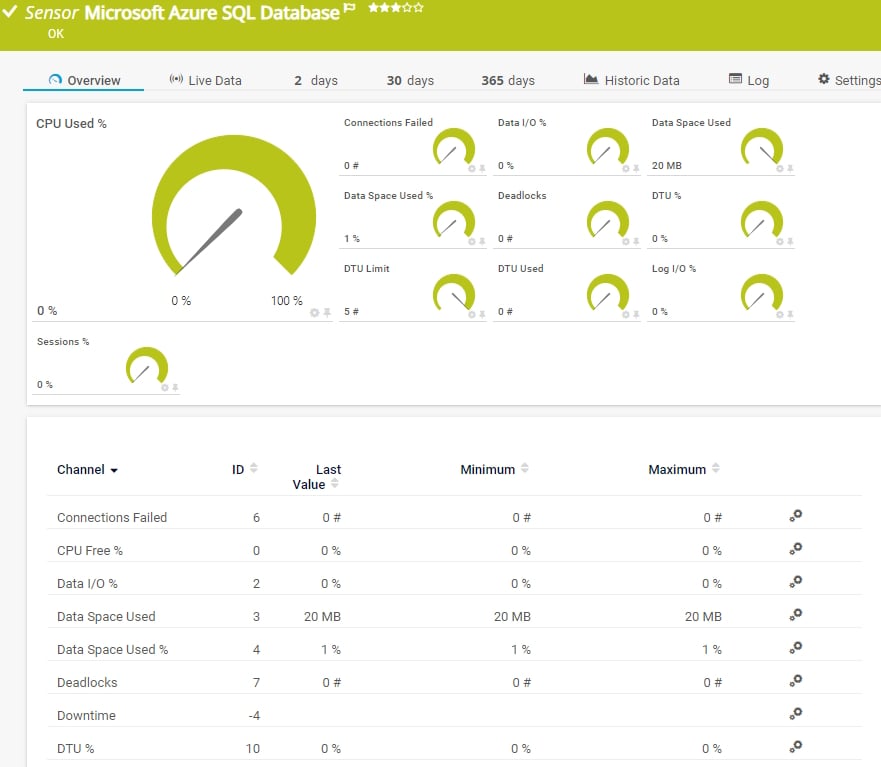
The Microsoft Azure SQL Database sensor monitors the metrics of an Azure SQL Database (single database or elastic pool) in a Microsoft Azure subscription. It can show the following:
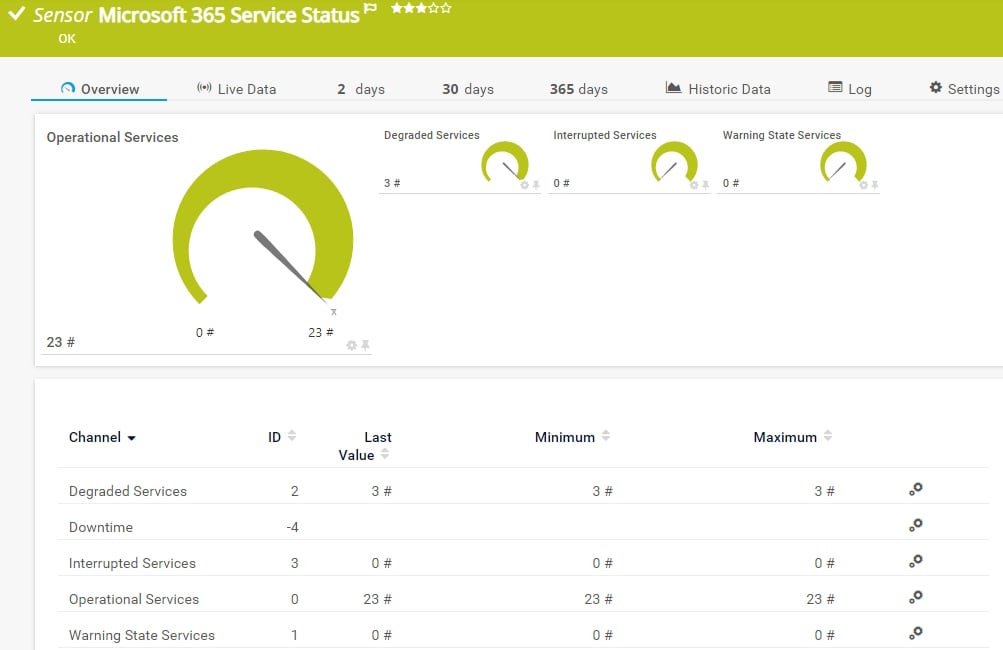
The Microsoft 365 Service Status sensor accesses the Microsoft API to monitor the overall status of all services of a Microsoft 365 subscription. It can show the following:
See the PRTG Manual for a list of all available sensor types.

Custom alerts and data visualization let you quickly identify and prevent costly Azure VM performance degradation.
PRTG is set up in a matter of minutes and can be used on a wide variety of mobile devices.

Partnering with innovative IT vendors, Paessler unleashes synergies to create
new and additional benefits for joined customers.
Combining PRTG’s broad monitoring feature set with IP Fabric’s automated network assurance creates a new level of network visibility and reliability.
IT that works constitutes a business-critical basis for a company's success. Availability and security must be defined for the respective purpose and closely monitored – by OT and IT alike.
Monitor all major physical hazards in IT rooms and racks such as critical climate factors, fire or burglary.
Real-time notifications mean faster troubleshooting so that you can act before more serious issues occur.
Network Monitoring Software – Version 25.3.110.1313 (August 27, 2025)
Download for Windows and cloud-based version PRTG Hosted Monitor available
English, German, Spanish, French, Portuguese, Dutch, Russian, Japanese, and Simplified Chinese
Network devices, bandwidth, servers, applications, virtual environments, remote systems, IoT, and more
Choose the PRTG Network Monitor subscription that's best for you
An Azure VM monitoring tool is a software solution that tracks the performance, availability, and health of virtual machines running in Microsoft Azure. These tools collect data from Azure monitor agents, track CPU usage, memory consumption, and disk performance while providing real-time alerts when issues occur. PRTG from Paessler offers comprehensive monitoring capabilities for Azure virtual machines, helping you maintain optimal performance of your cloud workloads.
PRTG monitors Azure virtual machines by connecting to the Azure portal via API and collecting performance metrics from your VMs. The monitoring solution deploys preconfigured sensors that track CPU usage, memory, disk space, and network traffic. PRTG can monitor both Windows and Linux virtual machines, providing insights into the guest operating system performance. It also integrates with Azure monitor logs and log analytics workspace to deliver comprehensive monitoring of your Azure resources.
PRTG offers flexible pricing options for monitoring Azure virtual machines based on the number of sensors you need. Each Azure VM typically requires multiple sensors to monitor different aspects like CPU, memory, and disk performance. PRTG licenses start with 500 sensors and scale up to enterprise-level deployments. Unlike the consumption-based pricing model of native Azure monitoring, PRTG provides predictable costs regardless of data volume, making it easier to budget for your monitoring needs.
Yes, PRTG provides powerful alert rules for Azure VM monitoring. You can set custom thresholds for CPU, memory, disk space, and other critical metrics. When these thresholds are exceeded, PRTG sends notifications through various channels including email, SMS, or push notifications. Our monitoring solution also supports automation of responses to specific alert conditions, helping you resolve issues before they impact your workloads or applications running on Azure VMs.
PRTG integrates seamlessly with multiple Azure services including Azure Monitor, VM insights, and Application Insights. It can collect data from log analytics workspaces and process information from data collection rules (DCR). PRTG can also monitor Azure SQL databases, storage accounts, and even Kubernetes clusters running in Azure. This integration provides a unified monitoring experience across your entire Azure environment, from VMs to apps and DevOps resources.
PRTG offers flexible pricing options for monitoring Azure virtual machines based on the number of sensors you need. Each Azure VM typically requires multiple sensors to monitor different aspects like CPU, memory, and disk performance. PRTG licenses start with 500 sensors and scale up to enterprise-level deployments. Unlike the consumption-based pricing model of native Azure monitoring, PRTG provides predictable costs regardless of data volume, making it easier to budget for your monitoring needs.
Absolutely! PRTG provides powerful visualization tools for Azure VM monitoring data, including customizable dashboards and detailed reports. You can create workbooks that display performance trends over time, helping you identify potential issues before they become critical. PRTG can visualize data from multiple sources including Azure monitor logs, Prometheus metrics, and Microsoft Sentinel alerts. These visualizations make it easy to track resource group performance, monitor endpoints, and ensure your Azure virtual machines are running optimally.
In PRTG, “sensors” are the basic monitoring elements. One sensor usually monitors one measured value in your network, for example the traffic of a switch port, the CPU load of a server, or the free space on a disk drive. On average, you need about 5-10 sensors per device or one sensor per switch port.
Paessler conducted trials in over 600 IT departments worldwide to tune its network monitoring software closer to the needs of sysadmins. The result of the survey: over 95% of the participants would recommend PRTG – or already have.

Paessler PRTG is used by companies of all sizes. Sysadmins love PRTG because it makes their job a whole lot easier.
Bandwidth, servers, virtual environments, websites, VoIP services – PRTG keeps an eye on your entire network.
Everyone has different monitoring needs. That’s why we let you try PRTG for free.