Custom alerts and data visualization let you quickly identify and prevent network pathing issues.
It's vital that you know how your data travels across your network, and whether packets are actually following the path you think they should. If traffic is losing its way, you need to know where the dead ends are. With Paessler PRTG you can quickly spot which hop is the troublemaker without having to use manual traceroute commands. The Traceroute Hop Count sensor can monitor the number of hops to reach a destination and alerts you when the route changes.
Traceroute monitoring with PRTG can give you vital insights into each segment of your network path, letting you control the traffic patterns, making sure it's following the path you want it to. By analyzing how ICMP packets travel through your infrastructure, you can identify inefficient routing that increases latency to critical applications. PRTG can also help you identify DNS-related issues that might be affecting how hostnames resolve, which can impact routing decisions and the overall performance of your network.
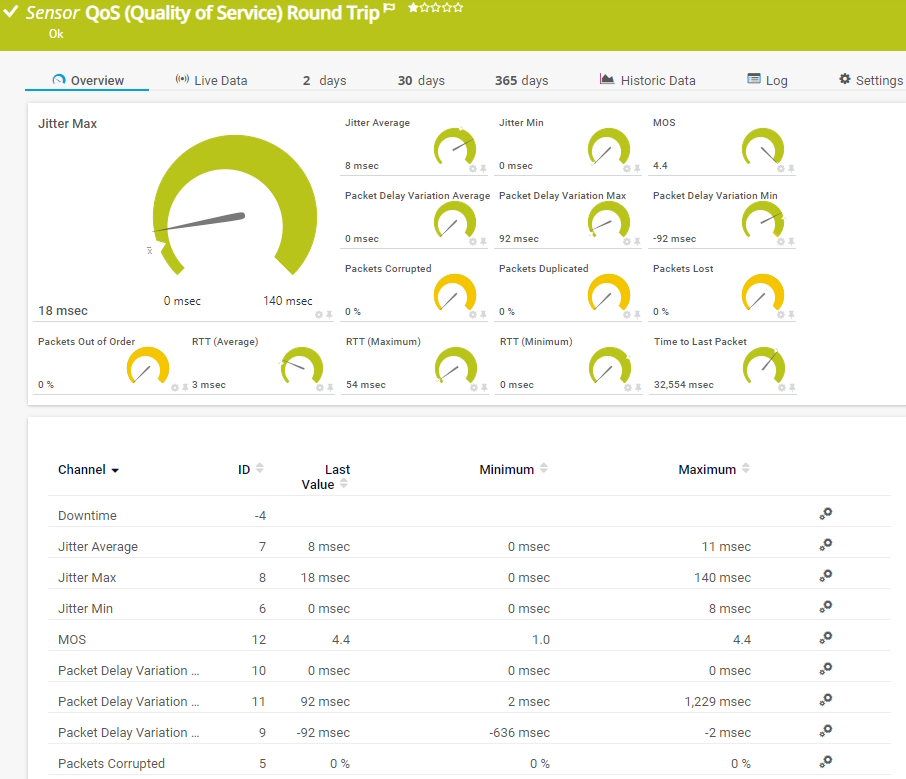
By measuring the response time at each hop, you can quickly identify which routers, firewalls or IP addresses are causing latency issues, letting you fix routing problems before they become an issue. The sensor QoS (Quality of Service) Round Trip in PRTG can complement your traceroute monitoring by measuring packet loss, jitter, and round-trip time between network points, giving you additional metrics to pinpoint performance bottlenecks in your network path.
Know your network inside and out - traceroute monitoring with PRTG gives you the evidence you need to convince your service provider that there's a problem. With detailed information for each hop, you can clearly see where your traffic enters your ISP's network and identify exactly which devices might be causing issues.
Diagnose network issues by monitoring the traffic path between IP addresses. Show hop by hop exactly how data packets travel through your network, and other key metrics in real time with PRTG’s Traceroute Hop Count sensor. Visualize monitoring data in clear graphs and dashboards to identify problems more easily. Gain the overview you need to troubleshoot traceroute issues.

Device tree view of the complete monitoring setup

Custom PRTG dashboard for keeping an eye on the entire IT infrastructure
Traceroute Hop Count sensor in PRTG

Ping sensor 30 days monitoring data
“All-around winning
network monitor”
“The real beauty of PRTG is the endless possibilities it offers”
“PRTG Network Monitor
is very hard to beat”
Manual traceroute commands can provide helpful snapshots, but they can't give you the continuous visibility needed to stay ahead of network issues. PRTG transforms traceroute from an occasional troubleshooting tool into a proactive monitoring powerhouse that illuminates your entire network landscape.
PRTG monitors your network paths in real-time and can alert you the moment routes change. When traffic takes an unexpected detour, visual comparisons and historical data help you quickly identify what changed. By tracking how ICMP packets traverse your network, PRTG provides early warning when routing patterns shift, letting you address issues before users notice problems with their connectivity.
If there's an issue with your network or your service provider, PRTG helps you identify exactly which hop in your network path is causing problems. With traceroute metrics (such as ICMP echo requests), you can quickly diagnose issues and provide detailed evidence when escalating to third parties. The TTL (Time To Live) values in each packet helps map out your network paths, giving you precise data on where traffic delays or packet loss is occurring.
Instead of reacting to problems, you can prevent them by checking your network paths are optimal with PRTG's dashboards. And when planning network changes, you have historical monitoring data to help make smart decisions, letting you keep your network devices running smoothly. PRTG's comprehensive monitoring includes not just traceroute data, but also integration with other metrics like bandwidth usage and response times for a complete picture of your network health across all operating systems.
PRTG comes with more than 250 native sensor types for monitoring your entire on-premises, cloud, and hybrid cloud environment out of the box. Check out some examples below!
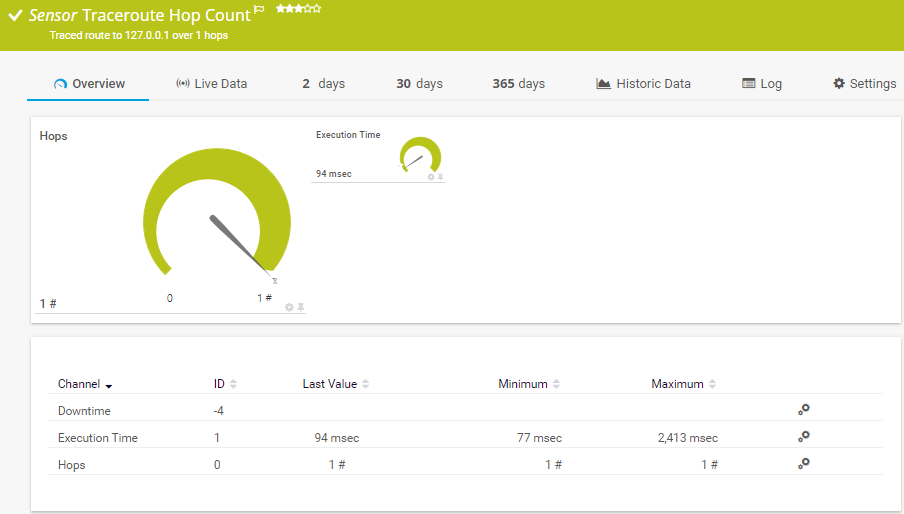
The Traceroute Hop Count sensor traces the number of hops from the probe system to the IP Address/DNS Name of the parent device. It can show the following:
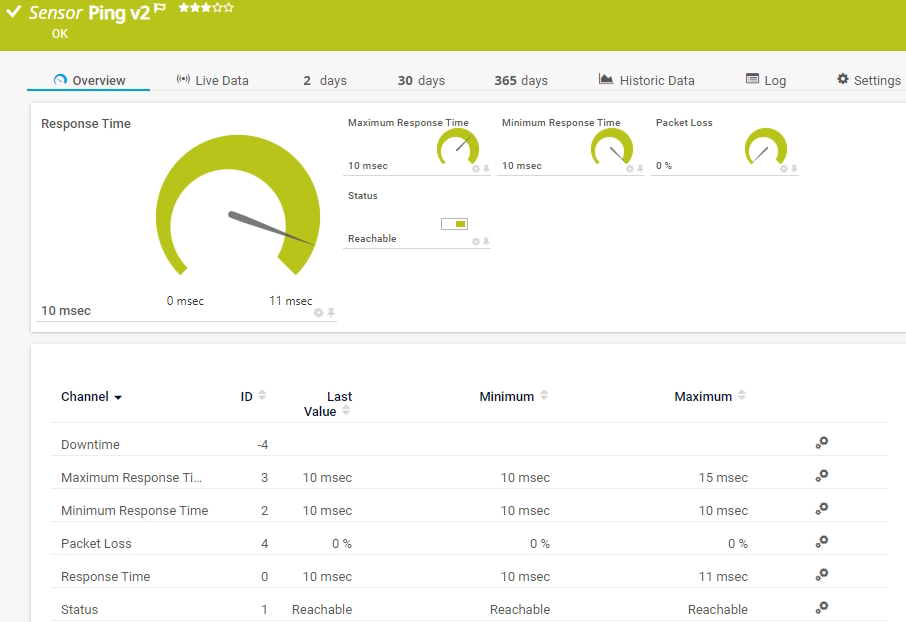
The Ping v2 sensor sends an Internet Control Message Protocol (ICMP) echo request ("ping") from the probe system to the parent device to monitor its availability. It can show the following:
• Response time
• Packet loss
• Target status
• Minimum and maximum ping time
The QoS (Quality of Service) Round Trip sensor monitors parameters regarding the quality of a network connection between two probes. It can show the following:
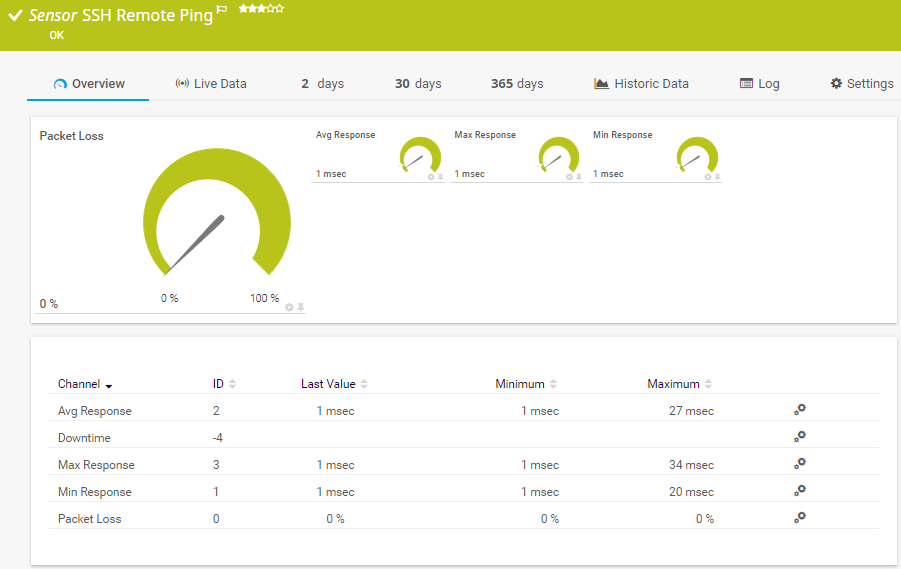
The SSH Remote Ping sensor remotely monitors the connectivity between a system running Linux/macOS X and another device, using Internet Control Message Protocol (ICMP) echo requests ("ping") and Secure Shell (SSH). It can show the following:
See the PRTG Manual for a list of all available sensor types.

Custom alerts and data visualization let you quickly identify and prevent network pathing issues.
PRTG is set up in a matter of minutes and can be used on a wide variety of mobile devices.


“Excellent tool for detailed monitoring. Alarms and notifications work greatly. Equipment addition is straight forward and server initial setup is very easy. ...feel safe to purchase it if you intend to monitor a large networking landscape.”
Partnering with innovative IT vendors, Paessler unleashes synergies to create
new and additional benefits for joined customers.
With the combination of PRTG and Insys, the monitoring specialist Paessler and the industrial gateway manufacturer INSYS icom offer a practical possibility to merge IT and OT.
Monitor all major physical hazards in IT rooms and racks such as critical climate factors, fire or burglary.
Paessler and Plixer provide a complete solution adding flow and metadata analysis to a powerful network monitoring tool.
Real-time notifications mean faster troubleshooting so that you can act before more serious issues occur.
Network Monitoring Software – Version 25.3.110.1313 (August 27, 2025)
Download for Windows and cloud-based version PRTG Hosted Monitor available
English, German, Spanish, French, Portuguese, Dutch, Russian, Japanese, and Simplified Chinese
Network devices, bandwidth, servers, applications, virtual environments, remote systems, IoT, and more
Choose the PRTG Network Monitor subscription that's best for you
Traceroute is a network diagnostic tool to help create digital roadmaps for your data. It shows you the exact path your packets take as they travel from your device to a destination IP address, revealing each router (or "hop") along the way. This technique reveals not just which network devices are handling your traffic, but also how long each hop takes to respond, giving you valuable data with which to troubleshoot connectivity problems. Traceroute works by manipulating the TTL (Time To Live) value in IP packets, causing each router in the path to return an ICMP Time Exceeded message.
PRTG can be used as a traceroute tool, providing comprehensive network path monitoring. Instead of waiting for connectivity issues to occur and running traceroute commands, PRTG's sensors can automatically run these checks at regular intervals, alerting you when paths change. PRTG's functionality includes monitoring from multiple locations using remote probes, visualizing path changes in helpful dashboards, and correlating route data with other metrics like response time and packet loss. This automation helps MSPs and network administrators identify routing issues before they impact the user experience.
Think of ping as asking a device "Are you there?", while traceroute asks "How do I get to you?". The Ping sensor simply checks if a device is reachable and how quickly it responds. The Traceroute Hop Count sensor, on the other hand, maps the entire journey your data takes through the network, showing each router it visits along the way. While ping is great for basic up/down monitoring, traceroute gives you the full picture when troubleshooting complex network issues. In Windows, the command is called "tracert" while Linux users typically use "traceroute" - PRTG's sensors work across both operating systems to provide consistent monitoring.
In PRTG, “sensors” are the basic monitoring elements. One sensor usually monitors one measured value in your network, for example the traffic of a switch port, the CPU load of a server, or the free space on a disk drive. On average, you need about 5-10 sensors per device or one sensor per switch port.
Paessler conducted trials in over 600 IT departments worldwide to tune its network monitoring software closer to the needs of sysadmins. The result of the survey: over 95% of the participants would recommend PRTG – or already have.

Paessler PRTG is used by companies of all sizes. Sysadmins love PRTG because it makes their job a whole lot easier.
Bandwidth, servers, virtual environments, websites, VoIP services – PRTG keeps an eye on your entire network.
Everyone has different monitoring needs. That’s why we let you try PRTG for free.