• Company
    • About Us
    • Case Studies
    • Press Center
    • Events
    • Careers
    • Blog
    • Contact us
  • Login
 
  • English
    • Deutsch
    • Español
    • Français
    • Italiano
    • Português
Paessler
                    - The Monitoring Experts
  • Products
    • Paessler PRTG
      Paessler PRTGMonitor your whole IT infrastructure
      • PRTG Network Monitor
      • PRTG Enterprise Monitor
      • PRTG Hosted Monitor
      • PRTG extensionsExtensions for Paessler PRTGExtend your monitoring to a new level
    • Icon Features
      FeaturesExplore all monitoring features
      • Maps & dashboards
      • Alerts & notifications
      • Multiple user interfaces
      • Distributed monitoring
      • Customizable reporting
  • Solutions
    • Industries
      IndustriesMonitor various industry sectors
      • Industrial
      • Healthcare
      • Data Center
      • Education
      • Finance
      • Government
    • IT Topics
      IT TopicsMonitor all areas of IT
      • Network Monitoring
      • Bandwidth Monitoring
      • SNMP Monitor
      • Network Mapping
      • WiFi Monitoring
      • Server Monitoring
  • Pricing
  • Resources
    • Getting Started
      Getting StartedModules for self-paced learning
    • How-to Guides
      How-to GuidesGet the most out of PRTG
    • Videos & Webinars
      Videos & WebinarsLearn from Paessler experts
    • IT  Knowledge
      IT KnowledgeExpand your IT knowledge
    • PRTG Manual
      PRTG ManualFull documentation
    • Knowledge Base
      Knowledge BaseShare community knowledge
    • PRTG Sensor Hub
      PRTG Sensor HubGet sensors, scripts & templates
    • Trainings
      PRTG TrainingLearn how to work with PRTG
  • Partners
    • icon star
      New Partners and MSPBecome a new partner or MSP
    • icon partner
      Partner PortalLog in to your partner account
    • icon search
      Find a PartnerFind partners selling Paessler products
    • icon technology
      Technology AlliancesSee Paessler technology partnerships
  • Company
    • About Us
    • Case Studies
    • Press Center
    • Events
    • Careers
    • Blog
    • Contact us
  • Login
  • English
    • Deutsch
    • Español
    • Français
    • Italiano
    • Português
  • Get a quote
  • Free trial
  1. Home>
  2. IT Topics>
  3. Network>
  4. Network Reporting
PRTG Logo

Network Reporting with PRTG

Create comprehensive reports while monitoring your entire IT infrastructure

  • Create automated, easy-to-read or more in-depth reports
  • Visualize & analyze historical data the way you want
  • Preconfigured report templates for quick deployment
Free download
product overview

Our users give top ratings for monitoring with Paessler PRTG

Gartner peer insights
spiceworks
Capterra
G2
Trustpilot

PRTG network reporting: What you will find on this page

Table of content
  • The challenge: How to choose the best network reporting tool?
  • What network reporting looks like in PRTG
  • The solution: Create & configure reports easily with our PRTG network reporting solution
  • 5 advantages of using the PRTG network reporting software
  • Network Reporting: FAQ

PRTG makes network reporting as easy as it gets

Custom reports and data visualization let you quickly identify and prevent network issues.

Free download
PRODUCT OVERVIEW

The challenge: How to choose the best network reporting tool?

Choosing the best network reporting tool depends on your needs but there are a few basic requirements to keep in mind.

Icon number one

Easy data source integration

Define the list of devices you want to use as data sources. For example, servers, load balancers, switches, routers, etc. These determine the number of sensors and the amount of bandwidth you need.

The more detailed information you want to collect, the more resources will be needed and the higher the costs. Moreover, it should be easy to integrate devices from different manufacturers.

Icon number two

Unified data display window

Choose a network reporting solution that can collect and process data from different network devices and analyze them all together. This way, you don’t need to switch between different user interfaces to analyze data from different sources.

Instead, you'll get a clear view of your network's health using a single window for displaying the data and generating comprehensive reports.

Icon number three

Automated reports

As a network administrator, you often spend tons of time reviewing all the historical data collected from various logs. To make this process quicker and easier, you should have a network reporting tool that not only gathers all collected data in one place but also lets you configure when and where to receive automated reports.

Icon number four

High scalability

The cost of a network monitoring & reporting tool usually depends on the number of devices and metrics of your network. When expanding the network, it is important to be able to monitor more devices and their metrics – that is, to scale up in an easy way.

In addition, it is important that the solution you choose can work with on-premises and hybrid infrastructures and cloud solutions alike.

What network reporting looks like in PRTG

Diagnose network issues by continuously tracking and comparing both live data and historical data and generating in-depth network reports. Show the availability, health, and performance of your enterprise network infrastructure and other key metrics in real time. Visualize monitoring data in clear graphs and dashboards, and use network mapping to identify problems more easily. Gain the overview you need to troubleshoot your entire network.

PRTG Screenshot device tree view

Device tree view of the complete monitoring setup

PRTG screenshot graph live data traffic

Live traffic data graph in PRTG

Sensor selection

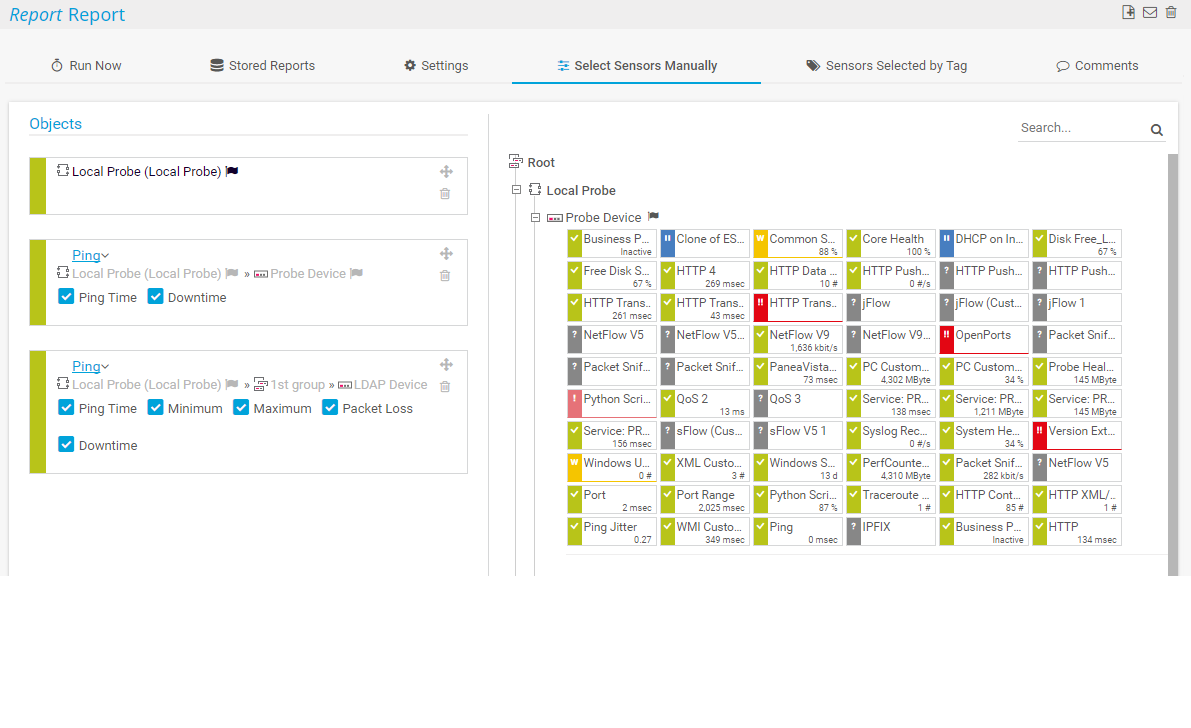
Sensor selection with PRTG

SNTP report

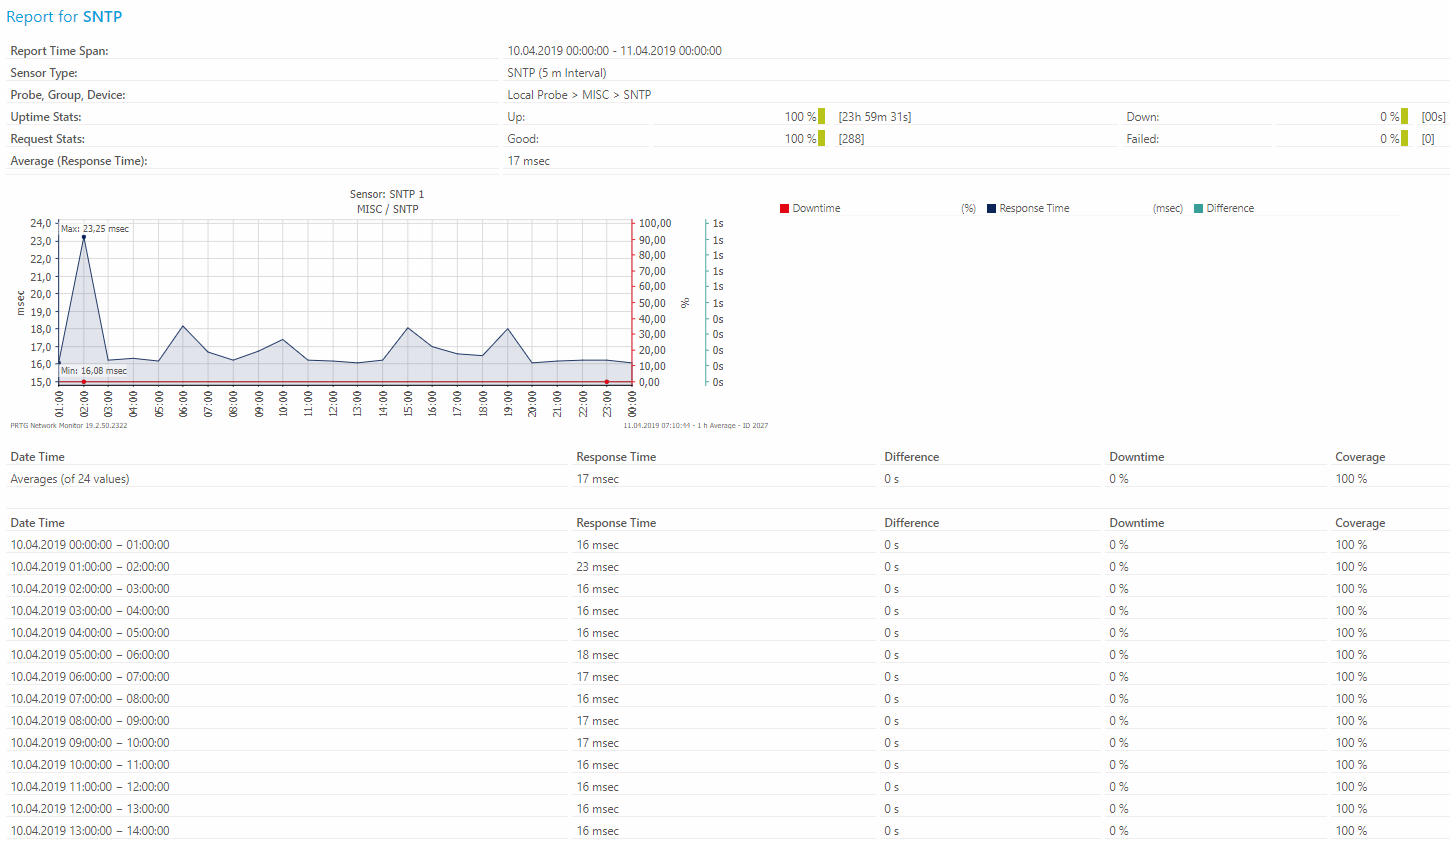
SNTP report with PRTG

Find the root cause of the problem with our PRTG network reporting solution

Real-time notifications mean faster troubleshooting so that you can act before more serious issues occur.

Free download
PRODUCT OVERVIEW

IT experts agree: Paessler PRTG is a great solution for IT infrastructure monitoring

PCMag

“All-around winning
 network monitor”

IT Brief

“The real beauty of PRTG is the endless possibilities it offers”

ITPro

“PRTG Network Monitor 
is very hard to beat”

The solution: Create & configure reports easily with PRTG

Paessler PRTG makes it easy to create reports and analyze data over a period of time (including historical data). You have the option to create reports for all PRTG sensors or only for specific ones.

Icon Alarm

Create reports quickly & easily

The process of creating reports is simple and intuitive. Choose a template and add the sensors from which you want to include data in the report. Set the time period for which you want to display the data. For performance reasons, PRTG automatically averages monitoring data when calculating data for large time periods.

In addition, be sure to specify whether the report will be generated on a schedule or only as needed. If according to a schedule, it’s necessary to indicate at what time intervals the report should be generated. You can specify the email address to which to send the finished report.

Icon report

Use preconfigured or custom reports

You can generate reports on demand or via schedules. PRTG generates reports in HTML, PDF, CSV, or XML format. In addition, there is an option to create specific HTML reports about your system configuration.

PRTG report templates define the overall look of your report and the granularity of your monitoring data. You can include, for example, raw data and extensive value tables for your IT colleagues in your report, or you include only data graphs for a more high-level overview for the management, for example.

Icon security

Restrict user access for more security

By using our network reporting tool, you can be sure that monitoring data is only available to you and the users to whom you have given access. PRTG uses modern technologies for network security:

  • SSL encryption (HTTPS, TLS, Elliptic Curve Cryptography, Forward Secrecy)
  • RSA certificate with 2048 bits
  • Tools to protect against various types of attacks, including cross-site scripting, directory traversal, and SQL injection attacks
  • Ability to manage access rights for each user account and for each user group
  • And much more

Start network reporting with PRTG and see how it can make your network more reliable and your job easier

Free download
PRODUCT OVERVIEW

PRTG is compatible with all major vendors, products, and systems

compatible with all major vendors, products, and systems

5 advantages of using the PRTG network reporting software

PRTG is a powerful and cost-effective network monitoring & reporting software which makes it easy to generate different types of reports that enable technicians to quickly view network performance and make critical decisions.

Great usability

  • One-click PRTG installer & automated monitoring setup
  • Powerful and easy-to-use user interfaces (for web, desktop, and mobile)
  • Interactive PRTG web interface to easily configure devices and sensors, view real-time data, configure alerts, and more

Great visualization

  • A single, central window for viewing the data of the entire network
  • Customizable dashboards & maps with drag-and-drop map editor
  • Ability to share monitoring data with specific users, for example, on network operation center screens

Great alerting

  • Customizable warning & error thresholds to be alerted if values are exceeded
  • Automated alerts with configurable escalation levels
  • Customizable notification system that sends notifications via e-mail, SMS, push notification, and more

Great integration

  • Agentless monitoring
  • More than 250 preconfigured PRTG sensors for comprehensive monitoring of your entire IT infrastructure
  • Vendor-agnostic network monitoring tool that supports devices of almost all manufacturers

Great support

  • Free 30-day trial version to test all sensors and features
  • Comprehensive Knowledge Base with useful information for mastering PRTG
  • Paessler Support team that helps you troubleshoot issues & answers your questions as quickly as possible

PRTG makes network reporting as easy as it gets

Custom reports and data visualization let you quickly identify and prevent network issues.

Free download
PRODUCT OVERVIEW

”Adopting PRTG has been like going from being in the dark to being in the light. Before, we had limited visibility into what was happening in the infrastructure and in the network. Now, however, thanks to the comprehensive dashboard and real-time notifications, we receive constant updates on the status of facilities and services, and our way of working has gone from passive to proactive.”

Luca Meneghesso, Senior IT infrastructure and Security Specialist
Banca Profilo

”GESAC increasingly focuses on innovation to improve the quality of services offered and the experience of passengers handled every day by Naples Airport. Thanks to PRTG, we finally have unified, automatic, and continuous monitoring of the airport network and can guarantee quick and timely interventions.”

Domenico Ciervo, GESAC ICT Manager
Naples International Airport

”As an international company, PRTG is ideal for us. If something went down half way across the world, we wouldn’t be woken up – we can rely on PRTG to identify the problem and alert us before it occurs – enabling the right person, in the right time zone to resolve the problem. At the end of the day, if we’re to provide an internal network experience for our employees that meets expectations, we need a tool like PRTG to be successful.”

Barry Kelly, Systems Engineer
Skyscanner

“I would recommend PRTG because it has helped us significantly improve service uptime by highlighting important alerts that would otherwise result in a system failure or service disruption if action was not taken. Thanks to PRTG, we can ensure that The Ritz London’s network and IT systems are five-star, just like the hotel.”

Richard Isted, IT Manager
The Ritz London


Your network reporting data at a glance – even on the go

PRTG is set up in a matter of minutes and can be used on a wide variety of mobile devices.

device overview
Gartner peer insights

“Excellent tool for detailed monitoring. Alarms and notifications work greatly. Equipment addition is straight forward and server initial setup is very easy. ...feel safe to purchase it if you intend to monitor a large networking landscape.”

Read the complete review at Gartner Peer Insights

Create innovative solutions with Paessler’s IT partners

Partnering with innovative IT vendors, Paessler unleashes synergies to create
new and additional benefits for joined customers.

IP Fabric

IP Fabric

Combining PRTG’s broad monitoring feature set with IP Fabric’s automated network assurance creates a new level of network visibility and reliability.

Read more
NetBrain

NetBrain

Integrating monitoring results from PRTG into NetBrain maps makes the foundation for network automation.

Read more
ScriptRunner

ScriptRunner

With ScriptRunner Paessler integrates a powerful event automation platform into PRTG Network Monitor.

Read more

Find the root cause of the problem with our PRTG network reporting solution

Real-time notifications mean faster troubleshooting so that you can act before more serious issues occur.

Free download
PRODUCT OVERVIEW
Paessler PRTG

Paessler PRTG

Network Monitoring Software – Version 24.4.102.1351 (November 12th, 2024)

Hosting icon

Hosting

Download for Windows and cloud-based version PRTG Hosted Monitor available

Languages icon

Languages

English, German, Spanish, French, Portuguese, Dutch, Russian, Japanese, and Simplified Chinese

test

Monitor everything

Network devices, bandwidth, servers, applications, virtual environments, remote systems, IoT, and more

test

Pricing

Choose the PRTG Network Monitor subscription that's best for you

Discover more monitoring insights and stories

Resources Solution

Solutions for all your monitoring needs

  • PRTG Network Monitor – All-in-one network monitoring tool
  • Network monitoring tool
  • How to: Free network monitoring
Resources Content

Powerful stories from the monitoring world

  • C-Level IT Reporting
  • Customer success story Idonix & PRTG
  • Infrastructure monitoring as a cornerstone of NIS2 compliance
Resources Solutions

Resources to master your monitoring challenges

  • Trends reporting for the entire PRTG
  • Network Uptime Report
  • Reports

Network Reporting: FAQ


What is network reporting?

Network reporting is an important tool for network administrators that allows them to visualize various data about network performance. Using network reports, administrators can identify and correct errors, optimize network performance, and make other important decisions.

Why is network reporting used?

With the help of network reports, you can structure and organize many important metrics of your network in a way that is easy to view and analyze. Analyzing reports allows you to find network bottlenecks, improve performance, predict future network performance, and make critical decisions about changes and upgrades.

What is a network reporting tool?

Network monitoring software must be able to collect and analyze data from various network devices such as routers, switches, servers, firewalls, load balancers, and other endpoints such as systems and applications. Network reporting tools present this collected data in the form of connected reports.

Network reports are a valuable tool for admins because they allow them to identify network trends, evaluate overall performance metrics, improve productivity, find the root cause of errors, and troubleshoot performance issues.

Because a network consists of many components and has many indicators of its operation and performance, there are a lot of different types of reports. The process of their creation and analysis can be quite a difficult task. Therefore, the network reporting tool must allow administrators to provide access to historical data and customize reports in a way that only relevant data is included.

Why should you use a network reporting tool?

Network reporting tools help network administrators to effectively manage their networks. Network monitoring solutions like Paessler PRTG Network Monitor provide data on network performance, and network reports allow you to summarize the information you receive in a convenient format that can be easily analyzed, extracted from, and shared.

The main tasks that network reporting tools can solve are:

  • Identify trends in network usage, network activity, and bandwidth
  • Monitor network availability and the uptime of network devices
  • Check performance metrics (for example, response time or CPU and RAM usage of servers and computers)
  • Make decisions based on live data and historical data
  • Predict, detect, diagnose, and resolve network issues before the network fails
  • Make decisions about optimizing your IT infrastructure and plan upgrades
  • Check the network topology
  • Deploy various protocols and technologies, for example SNMP, WMI, SSH, or NetFlow (for Cisco devices) for collecting data
  • Confirm compliance with service level agreements
  • Detect fraudulent activity

With our network reporting tool PRTG, you can collect network monitoring data and create and customize easy-to-read reports.

What information can you get from a network report?

Network performance reports can display thousands of network metrics that give you insights into performance, availability, existing issues, and more. With the help of reports, you can get important information about network baselines, hardware specifications and health, end-user experience, and other performance parameters.

Examples of information that a network report can contain:

  • Availability and status of an interface or node
  • Performance metrics such as CPU and memory usage
  • Packet delay and packet loss
  • Amount of network traffic
  • Port connection time
  • Uptime and downtime of network devices
  • And more
What is a sensor in PRTG?

In PRTG, “sensors” are the basic monitoring elements. One sensor usually monitors one measured value in your network, for example the traffic of a switch port, the CPU load of a server, or the free space on a disk drive. On average, you need about 5-10 sensors per device or one sensor per switch port.

We asked: would you recommend PRTG? Over 95% of our customers say yes!

Paessler conducted trials in over 600 IT departments worldwide to tune its network monitoring software closer to the needs of sysadmins. The result of the survey: over 95% of the participants would recommend PRTG – or already have.

recommendation

Still not convinced?

Love

More than 500,000 sysadmins love PRTG

Paessler PRTG is used by companies of all sizes. Sysadmins love PRTG because it makes their job a whole lot easier.

PRTG

Monitor your entire IT infrastructure

Bandwidth, servers, virtual environments, websites, VoIP services – PRTG keeps an eye on your entire network.

test

Try Paessler PRTG for free

Everyone has different monitoring needs. That’s why we let you try PRTG for free.

PRTG Logo

Start network reporting with PRTG and see how it can make your network more reliable and your job easier

Free download
PRODUCT OVERVIEW

Products

  • Paessler PRTG
    Paessler PRTGMonitor your whole IT infrastructure
    • PRTG Network Monitor
    • PRTG Enterprise Monitor
    • PRTG Hosted Monitor
    • PRTG extensions
      Extensions for Paessler PRTGExtend your monitoring to a new level
  • Icon Features
    FeaturesExplore all monitoring features

Monitoring with PRTG

  • Network monitoring
  • Bandwidth monitoring
  • SNMP monitoring
  • Network mapping
  • Wi-Fi monitoring
  • Server monitoring
  • Network traffic analyzer
  • NetFlow monitoring
  • Syslog server

Useful Links

  • PRTG Manual
  • Knowledge Base
  • Customer Success Stories
  • About Paessler
  • Subscribe to newsletter
  • PRTG Support
  • PRTG Consulting

Contact

Paessler GmbH
Thurn-und-Taxis-Str. 14, 
90411 Nuremberg 
Germany

info@paessler.com

+49 911 93775-0

  • Contact us
©2025 Paessler GmbHTerms & ConditionsPrivacy PolicyImprintReport VulnerabilityDownload & InstallSitemap
404 - Page not found 404 - Page not found 404 - Page not found