• Company
    • About Us
    • Case Studies
    • Press Center
    • Events
    • Careers
    • Blog
    • Contact us
  • Contact us
  • Login
 
  • English
    • Deutsch
    • Español
    • Français
    • Italiano
    • Português
Paessler
                    - The Monitoring Experts
  • Products
    • Paessler PRTG
      Paessler PRTGMonitor your whole IT infrastructure
      • PRTG Network Monitor
      • PRTG Enterprise Monitor
      • PRTG Hosted Monitor
      • PRTG extensionsExtensions for Paessler PRTGExtend your monitoring to a new level
    • Icon Features
      FeaturesExplore all monitoring features
      • Maps & dashboards
      • Alerts & notifications
      • Multiple user interfaces
      • Distributed monitoring
      • Customizable reporting
  • Solutions
    • Industries
      IndustriesMonitor various industry sectors
      • Industrial
      • Healthcare
      • Data Center
      • Education
      • Finance
      • Government
    • IT Topics
      IT TopicsMonitor all areas of IT
      • Network Monitoring
      • Bandwidth Monitoring
      • SNMP Monitor
      • Network Mapping
      • WiFi Monitoring
      • Server Monitoring
  • Pricing
  • Resources
    • Getting Started
      Getting StartedModules for self-paced learning
    • How-to Guides
      How-to GuidesGet the most out of PRTG
    • Videos & Webinars
      Videos & WebinarsLearn from Paessler experts
    • IT  Knowledge
      IT KnowledgeExpand your IT knowledge
    • PRTG Manual
      PRTG ManualFull documentation
    • Knowledge Base
      Knowledge BaseShare community knowledge
    • PRTG Sensor Hub
      PRTG Sensor HubGet sensors, scripts & templates
    • Trainings
      PRTG TrainingLearn how to work with PRTG
  • Partners
    • icon star
      New Partners and MSPBecome a new partner or MSP
    • icon partner
      Partner PortalLog in to your partner account
    • icon search
      Find a PartnerFind partners selling Paessler products
    • icon technology
      Technology AlliancesSee Paessler technology partnerships
  • Company
    • About Us
    • Case Studies
    • Press Center
    • Events
    • Careers
    • Blog
    • Contact us
  • Contact us
  • Login
  • English
    • Deutsch
    • Español
    • Français
    • Italiano
    • Português
  • Get a quote
  • Free trial
  1. Home>
  2. IT Topics>
  3. Network>
  4. Network Telemetry Software
PRTG Logo

Network Telemetry with PRTG

Obtain complete visibility into your network performance and identify problems before they impact your users

  • Reduce downtime with real-time alerts that identify problems immediately
  • Customize your data visualization to make insights clear and actionable
  • Boost your troubleshooting speed with detailed root-cause insights
Free download
product overview

Our users give top ratings for monitoring with Paessler PRTG

Gartner peer insights
spiceworks
Capterra
G2
Trustpilot

PRTG network telemetry: What you will find on this page

Table of content
  • Achieve optimal network performance with advanced network telemetry
  • What network telemetry looks like in PRTG
  • 3 reasons why PRTG is the network telemetry tool of your choice
  • Explore our preconfigured PRTG sensors for network telemetry
  • Network Telemetry: FAQ

PRTG makes network telemetry as easy as it gets

Custom alerts and data visualization let you quickly identify and prevent network issues.

Free download
PRODUCT OVERVIEW

Achieve optimal network performance with advanced network telemetry

With PRTG as your network telemetry software, you will gain real-time insights that will change your way of managing your network. Immediately know where bottlenecks or performance degradations are occurring, receive alerts the moment a problem occurs, and resolve it before it affects your users. PRTG gives you the control, visibility and automation you need to make network management proactive and seamless.

Icon reports

Detailed reporting

Get clear, customizable reports to understand network trends and performance over time.

Icon alerts

Automated alerts

Receive real-time notifications the moment your network needs attention, preventing downtime.

Icon dashboard

Easy-to-use dashboards

View critical metrics at a glance with intuitive dashboards tailored to your needs.

Icon integration

Comprehensive integration

Easy integration with your existing tools and protocols, including SNMP, NetFlow, and IPFIX.

What network telemetry looks like in PRTG

Diagnose network issues by continuously tracking latency, bandwidth, and device health. Show network performance, traffic patterns and other key metrics in real time. Visualize monitoring data in clear graphs and dashboards to identify problems more easily. Gain the overview you need to troubleshoot bottlenecks and performance issues.

PRTG screenshot graph live data traffic

Live traffic data graph in PRTG

PRTG Screenshot device tree view

Device tree view of the complete monitoring setup

PRTG screenshot map entire it infrastructure

Custom PRTG dashboard for keeping an eye on the entire IT infrastructure

PRTG screenshot graph live data traffic

Live traffic data graph in PRTG

PRTG Screenshot device tree view

Device tree view of the complete monitoring setup

Start network telemetry with PRTG and see how it can make your network more reliable and your job easier.

Free download
PRODUCT OVERVIEW

IT experts agree: Paessler PRTG is a great solution for IT infrastructure monitoring

PCMag

“All-around winning
 network monitor”

IT Brief

“The real beauty of PRTG is the endless possibilities it offers”

ITPro

“PRTG Network Monitor 
is very hard to beat”

3 reasons why PRTG is the network telemetry tool of your choice

Network telemetry can be overwhelming. Too much data, complex setups, and unclear insights make it difficult to maintain control. Without a reliable tool, you risk missing critical issues or spending hours sifting through raw data. PRTG simplifies the process so you get the information you need - without the hassle.

Icon licensing

Simple licensing

Choose a flexible subscription that fits your needs with no hidden costs. Upgrade or scale as your network grows without complicated contracts. Pay for what you need, not more. Enjoy predictable pricing that keeps your budget under control.

Icon support

Fast support

Get expert help when you need it, from real people who understand network monitoring. Avoid frustrating delays with fast responses and practical solutions. Rely on a dedicated team to keep your network running smoothly. Never waste time searching for answers when help is just a message away.

Icon configuration

Easy setup

Skip long setup times and get up and running in minutes. Use automatic network discovery to detect devices instantly. Configure sensors easily with pre-built templates and an intuitive interface. Focus on monitoring instead of spending hours on installation.

Explore our preconfigured PRTG sensors for network telemetry

PRTG comes with more than 250 native sensor types for monitoring your entire on-premises, cloud, and hybrid cloud environment out of the box. Check out some examples below!

SNMP Traffic v2

The SNMP Traffic v2 sensor monitors bandwidth and traffic on a device. It can show the following:

  • Number of incoming and outgoing broadcast, multicast, unicast, and non-unicast packets
  • Number of incoming and outgoing discards and errors
  • Total, incoming, and outgoing traffic
  • Number of incoming, unknown protocols
SNMP Traffic v2
SNMP Traffic v2

NetFlow v9

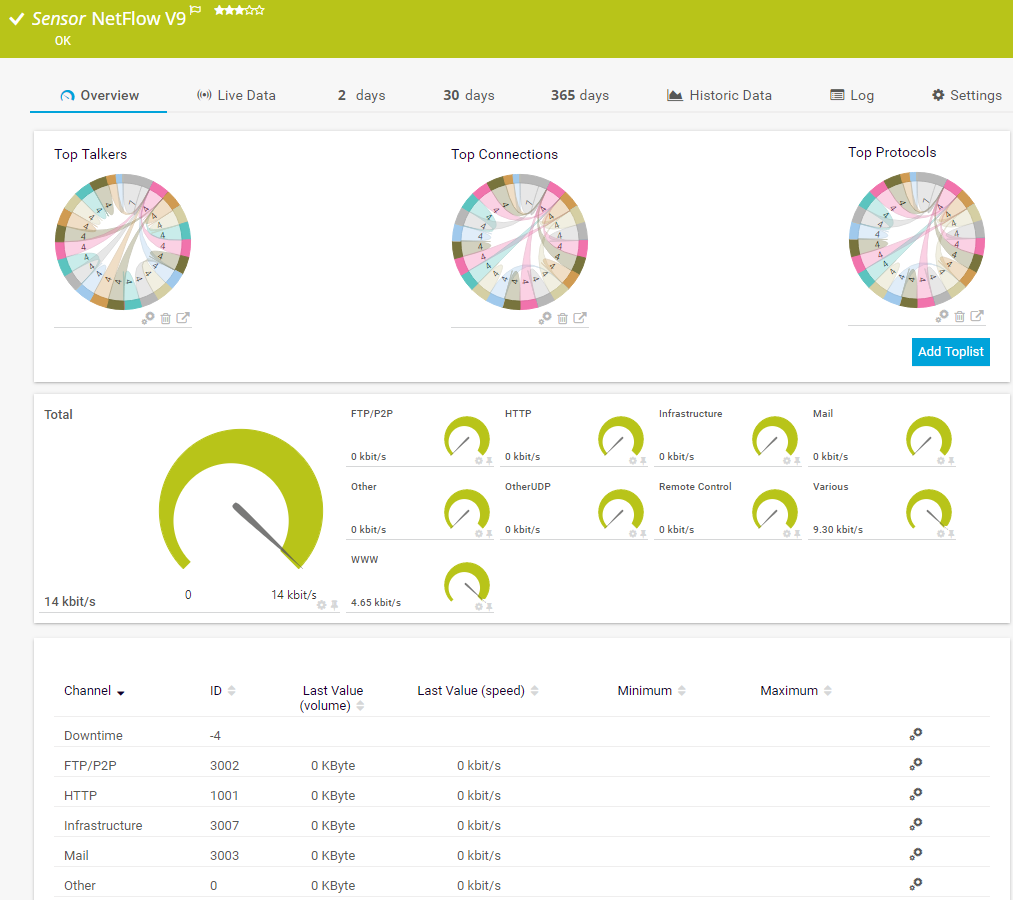
The NetFlow v9 sensor receives traffic data from a NetFlow v9-compatible device and shows the traffic by type. This sensor has several filter options to divide traffic into different channels. It can show the following and more:

  • Traffic from Citrix applications
  • Traffic from file transfer (FTP/P2P) and various other protocols (UDP, TCP)
  • Traffic from network services (DHCP, DNS, Ident, ICMP, SNMP)
  • Internet mail traffic (IMAP, POP3, SMTP)
  • Traffic from remote control applications (RDP, SSH, Telnet, Virtual Network Computing (VNC))
NetFlow v9
NetFlow v9

sFlow

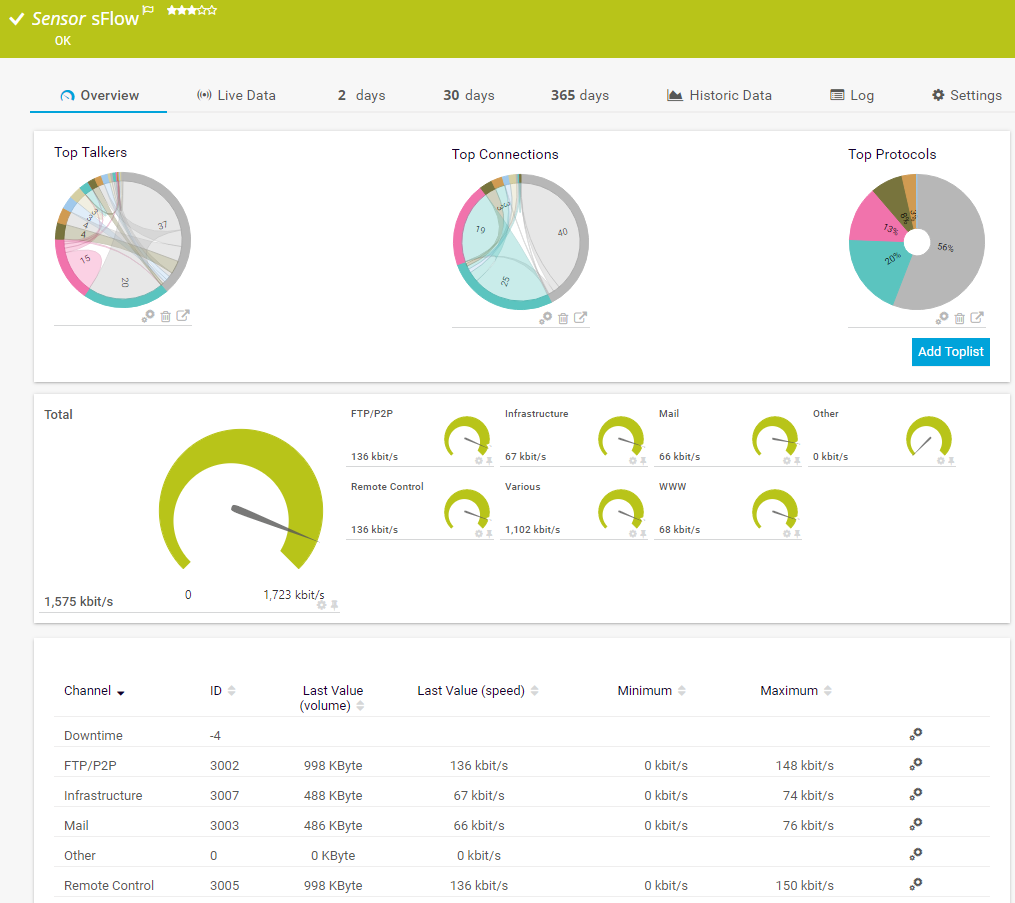
The sFlow sensor receives traffic data from an sFlow v5-compatible device and shows the traffic by type. This sensor has several filter options to divide traffic into different channels. It can show the following and more:

  • Traffic from Citrix applications
  • Traffic from file transfer (FTP/P2P) and various other protocols (UDP, TCP)
  • Traffic from network services (DHCP, DNS, Ident, ICMP, SNMP)
  • Internet mail traffic (IMAP, POP3, SMTP)
  • Traffic from remote control applications (RDP, SSH, Telnet, Virtual Network Computing (VNC))
sFlow
sFlow

IPFIX

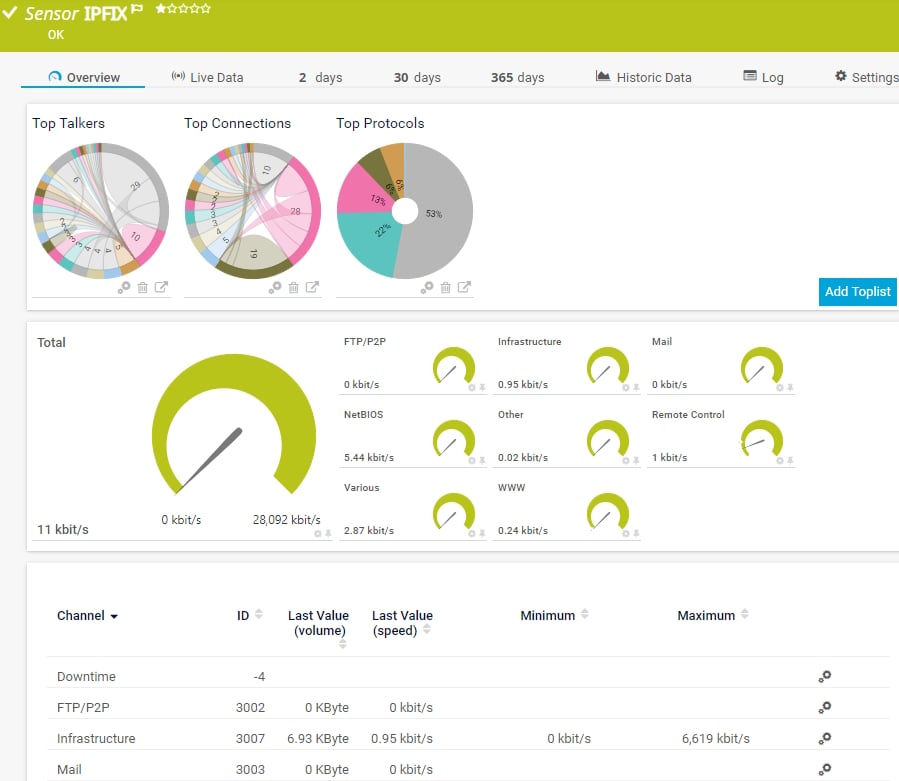
The IPFIX sensor receives traffic data from an Internet Protocol Flow Information Export (IPFIX) compatible device and shows traffic by type. It can show the following and more:

  • Traffic from Citrix applications
  • Traffic from file transfer (FTP/P2P) and various other protocols (UDP, TCP)
  • Traffic from network services (DHCP, DNS, Ident, ICMP, SNMP)
  • Internet mail traffic (IMAP, POP3, SMTP)
  • Traffic from remote control applications (RDP, SSH, Telnet, Virtual Network Computing (VNC))
PFIX
PFIX

HTTP v2

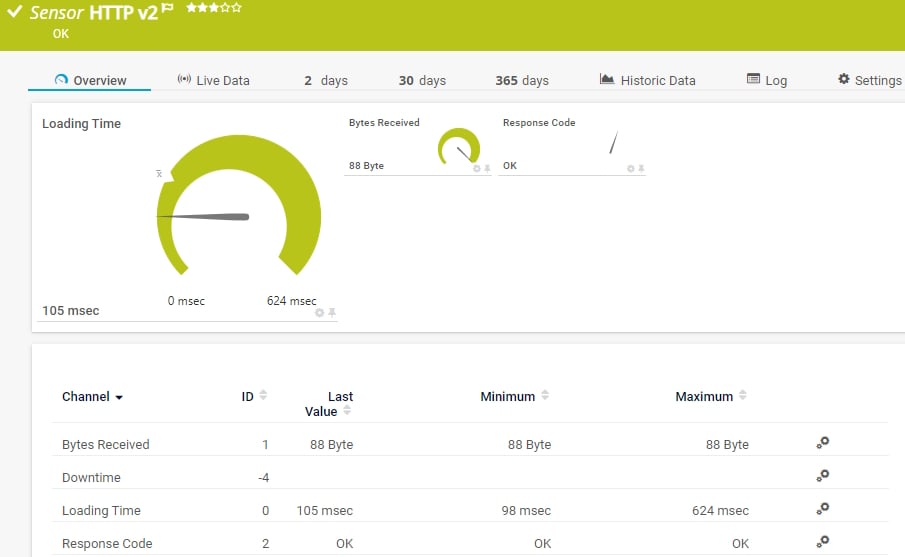
The HTTP v2 sensor monitors a web server. It can show the following:

  • Number of bytes received
  • Web page or element loading time
  • Response code of the target server
HTTP v2
HTTP v2

See the PRTG Manual for a list of all available sensor types.

PRTG is compatible with all major vendors, products, and systems

compatible with all major vendors, products, and systems

PRTG makes network telemetry as easy as it gets

Custom alerts and data visualization let you quickly identify and prevent network bottlenecks.

Free download
PRODUCT OVERVIEW

“I would recommend PRTG because it has helped us significantly improve service uptime by highlighting important alerts that would otherwise result in a system failure or service disruption if action was not taken. Thanks to PRTG, we can ensure that The Ritz London’s network and IT systems are five-star, just like the hotel.”

Richard Isted, IT Manager
The Ritz London

”Adopting PRTG has been like going from being in the dark to being in the light. Before, we had limited visibility into what was happening in the infrastructure and in the network. Now, however, thanks to the comprehensive dashboard and real-time notifications, we receive constant updates on the status of facilities and services, and our way of working has gone from passive to proactive.”

Luca Meneghesso, Senior IT infrastructure and Security Specialist
Banca Profilo

”GESAC increasingly focuses on innovation to improve the quality of services offered and the experience of passengers handled every day by Naples Airport. Thanks to PRTG, we finally have unified, automatic, and continuous monitoring of the airport network and can guarantee quick and timely interventions.”

Domenico Ciervo, GESAC ICT Manager
Naples International Airport

”As an international company, PRTG is ideal for us. If something went down half way across the world, we wouldn’t be woken up – we can rely on PRTG to identify the problem and alert us before it occurs – enabling the right person, in the right time zone to resolve the problem. At the end of the day, if we’re to provide an internal network experience for our employees that meets expectations, we need a tool like PRTG to be successful.”

Barry Kelly, Systems Engineer
Skyscanner

“I would recommend PRTG because it has helped us significantly improve service uptime by highlighting important alerts that would otherwise result in a system failure or service disruption if action was not taken. Thanks to PRTG, we can ensure that The Ritz London’s network and IT systems are five-star, just like the hotel.”

Richard Isted, IT Manager
The Ritz London

”Adopting PRTG has been like going from being in the dark to being in the light. Before, we had limited visibility into what was happening in the infrastructure and in the network. Now, however, thanks to the comprehensive dashboard and real-time notifications, we receive constant updates on the status of facilities and services, and our way of working has gone from passive to proactive.”

Luca Meneghesso, Senior IT infrastructure and Security Specialist
Banca Profilo

Your network telemetry software at a glance – even on the go

PRTG is set up in a matter of minutes and can be used on a wide variety of mobile devices.

device overview
Cisco

We are a Cisco Select Developer Partner  

As a member of the Cisco Partner Program, Paessler is one of the market leaders that enhances the Cisco technology portfolio with products that are proven to easily integrate with Cisco devices.

What does this mean for you?

  • Easy integration of Cisco hardware and software with PRTG
  • State-of-the-art features for monitoring your Cisco environment
  • Expert technical support around your Cisco monitoring setup

Find the root cause of the problem with our PRTG network telemetry solution

Real-time notifications mean faster troubleshooting so that you can act before more serious issues occur.

Free download
PRODUCT OVERVIEW
Paessler PRTG

Paessler PRTG

Network Monitoring Software – Version 25.2.106.1114 (May 05th, 2025)

Hosting icon

Hosting

Download for Windows and cloud-based version PRTG Hosted Monitor available

Languages icon

Languages

English, German, Spanish, French, Portuguese, Dutch, Russian, Japanese, and Simplified Chinese

test

Monitor everything

Network devices, bandwidth, servers, applications, virtual environments, remote systems, IoT, and more

test

Pricing

Choose the PRTG Network Monitor subscription that's best for you

Network Telemetry: FAQ


What is network telemetry software?

Network telemetry software collects and analyzes real-time data from network devices to provide a detailed view of network performance and health. By monitoring network traffic, latency, and other performance metrics, network telemetry software enables you to quickly discover and troubleshoot issues, optimize connectivity, and improve overall user experience.

How does network telemetry software help with application performance?

Network telemetry tools monitor factors that impact application performance, such as packet loss, latency, and bandwidth usage. By tracking these metrics, you can understand how network conditions affect app performance, optimize resources, and ensure a smooth experience for end-users, even across complex networks.

Can PRTG be used as a scalable network telemetry tool?

Yes, PRTG is designed to scale efficiently across network environments of all sizes. Whether monitoring small offices or large data centers, PRTG adapts to your network infrastructure and grows with your organization. The software monitors everything from routers and firewalls to data collection pipelines, providing insights into various use cases across your infrastructure.

Does PRTG support different network devices and protocols?

PRTG supports a wide range of network devices and protocols, including SNMP, Flow (NetFlow, IPFIX), and WMI, making it compatible with devices from providers like Cisco and Juniper. This flexibility ensures PRTG can seamlessly monitor diverse setups and unify your data for easier analysis even via API.

How does PRTG use data visualization and reporting for network data?

PRTG offers powerful data visualization and reporting tools that simplify network data management. Interactive dashboards let you view key metrics at a glance, while detailed reports provide a comprehensive view of your network's status over time. These tools enable you to set thresholds for alerts, analyze data, and optimize network performance.

What makes Paessler PRTG a cost-effective network telemetry solution?

PRTG provides a cost-effective approach to network monitoring with flexible pricing options to suit different needs. With PRTG, you get a full management system that covers everything from topology mapping to real-time monitoring tools, all without the need for additional apps or costly aggregation solutions. This makes it easy to achieve network visibility on any budget.

What is a sensor in PRTG?

In PRTG, “sensors” are the basic monitoring elements. One sensor usually monitors one measured value in your network, for example the traffic of a switch port, the CPU load of a server, or the free space on a disk drive. On average, you need about 5-10 sensors per device or one sensor per switch port.

We asked: would you recommend PRTG? Over 95% of our customers say yes!

Paessler conducted trials in over 600 IT departments worldwide to tune its network monitoring software closer to the needs of sysadmins. The result of the survey: over 95% of the participants would recommend PRTG – or already have.

recommendation

Still not convinced?

Love

More than 500,000 sysadmins love PRTG

Paessler PRTG is used by companies of all sizes. Sysadmins love PRTG because it makes their job a whole lot easier.

PRTG

Monitor your entire IT infrastructure

Bandwidth, servers, virtual environments, websites, VoIP services – PRTG keeps an eye on your entire network.

test

Try Paessler PRTG for free

Everyone has different monitoring needs. That’s why we let you try PRTG for free.

PRTG Logo

Start network telemetry with PRTG and see how it can make your network more reliable and your job easier.

Free download
PRODUCT OVERVIEW

Products

  • Paessler PRTG
    Paessler PRTGMonitor your whole IT infrastructure
    • PRTG Network Monitor
    • PRTG Enterprise Monitor
    • PRTG Hosted Monitor
  • PRTG extensions
    Extensions for Paessler PRTGExtend your monitoring to a new level
  • Icon Features
    FeaturesExplore all monitoring features

Monitoring with PRTG

  • Network monitoring
  • Bandwidth monitoring
  • SNMP monitoring
  • Network mapping
  • Wi-Fi monitoring
  • Server monitoring
  • Network traffic analyzer
  • NetFlow monitoring
  • Syslog server

Useful Links

  • PRTG Manual
  • Knowledge Base
  • Customer Success Stories
  • About Paessler
  • Subscribe to newsletter
  • PRTG Support
  • PRTG Consulting

Contact

Paessler GmbH
Thurn-und-Taxis-Str. 14, 
90411 Nuremberg 
Germany

info@paessler.com

+49 911 93775-0

  • Contact us
©2025 Paessler GmbHTerms & ConditionsPrivacy PolicyImprintReport VulnerabilityDownload & InstallSitemap
404 - Page not found 404 - Page not found 404 - Page not found