• Company
    • About Us
    • Case Studies
    • Press Center
    • Events
    • Careers
    • Blog
    • Contact us
  • Login
 
  • English
    • Deutsch
    • Español
    • Français
    • Italiano
    • Português
Paessler
                    - The Monitoring Experts
  • Products
    • Paessler PRTG
      Paessler PRTGMonitor your whole IT infrastructure
      • PRTG Network Monitor
      • PRTG Enterprise Monitor
      • PRTG Hosted Monitor
      • PRTG extensionsExtensions for Paessler PRTGExtend your monitoring to a new level
    • Icon Features
      FeaturesExplore all monitoring features
      • Maps & dashboards
      • Alerts & notifications
      • Multiple user interfaces
      • Distributed monitoring
      • Customizable reporting
  • Solutions
    • Industries
      IndustriesMonitor various industry sectors
      • Industrial
      • Healthcare
      • Data Center
      • Education
      • Finance
      • Government
    • IT Topics
      IT TopicsMonitor all areas of IT
      • Network Monitoring
      • Bandwidth Monitoring
      • SNMP Monitor
      • Network Mapping
      • WiFi Monitoring
      • Server Monitoring
  • Pricing
  • Resources
    • Getting Started
      Getting StartedModules for self-paced learning
    • How-to Guides
      How-to GuidesGet the most out of PRTG
    • Videos & Webinars
      Videos & WebinarsLearn from Paessler experts
    • IT  Knowledge
      IT KnowledgeExpand your IT knowledge
    • PRTG Manual
      PRTG ManualFull documentation
    • Knowledge Base
      Knowledge BaseShare community knowledge
    • PRTG Sensor Hub
      PRTG Sensor HubGet sensors, scripts & templates
    • Trainings
      PRTG TrainingLearn how to work with PRTG
  • Partners
    • icon star
      New Partners and MSPBecome a new partner or MSP
    • icon partner
      Partner PortalLog in to your partner account
    • icon search
      Find a PartnerFind partners selling Paessler products
    • icon technology
      Technology AlliancesSee Paessler technology partnerships
  • Company
    • About Us
    • Case Studies
    • Press Center
    • Events
    • Careers
    • Blog
    • Contact us
  • Login
  • English
    • Deutsch
    • Español
    • Français
    • Italiano
    • Português
  • Get a quote
  • Free trial
  1. Home>
  2. IT Topics>
  3. Network>
  4. Network Monitoring Best Practices
PRTG Logo

Network Monitoring Best Practices with PRTG

Keep your network healthy and available, round the clock

  • See best practices for monitoring your IT infrastructure
  • Learn how to keep a 24/7 eye on network functionality
  • Get tips for monitoring every aspect of your devices and services
Free download
product overview

Our users give top ratings for monitoring with Paessler PRTG

Gartner peer insights
spiceworks
Capterra
G2
Trustpilot

PRTG network monitoring best practices: What you will find on this page

Table of content
  • Why network monitoring best practices are important
  • 4 best practices for monitoring your entire network
  • What network monitoring best practices looks like in PRTG
  • Explore our preconfigured PRTG sensors for network monitoring
  • Network Monitoring Best Practices : FAQ

PRTG makes network management as easy as it gets

Custom alerts and data visualization let you quickly identify and prevent outages and other network issues.

Free download
PRODUCT OVERVIEW

Why network monitoring best practices are important

Network monitoring best practices are the foundation for efficient and comprehensive monitoring of your entire IT infrastructure.

Problems happen fast: A router goes down, and soon your entire network begins to suffer. When you’re caught off guard, it can take hours to uncover the source of the error. In the worst case scenario, a malfunctioning device or IT service can bring your entire company to a standstill. This can have a considerable impact on the sales of your company and damage its reputation.

Solve this by following the effective network monitoring best practices below – and make it easy by using a tried and tested network monitoring tool like Paessler PRTG that helps IT teams and network administrators to address issues fast.

Table of content

4 best practices for monitoring your entire network


Icon Workstation

Smooth-running devices are vital

For your network to function properly, it's crucial to monitor your network infrastructure – including network devices like routers and switches – to ensure they are always operational. A single defective switch port or broken Ethernet cable can lead to serious malfunctions and disruptions.

If a server crashes or the VPN connection of an employee working remotely goes down, it’s not long before the entire company feels the fallout. This can cost your company dearly. This means 24/7 monitoring of your network infrastructure with a tool like PRTG is imperative.

icon loadbalance

Ensure reliable network data traffic

Too much data traffic can slow down your network. For example, excessive throughput strains bandwidth on your routers and switches and large amounts of data will obstruct hard disks and other storage devices. These types of situations will have a major impact on network performance.

You need a tool like PRTG that monitors bandwidth usage and analyzes network traffic and keeps you updated at all times. This lets you quickly take proactive action in the event that traffic spikes or a storage unit reaches its capacity.

icon protection

Enhance the security of your network

Along with performance, network security plays a major role in the functionality of your IT infrastructure. Firewalls must be configured properly, antivirus software must be up and running at all times, and updates must be automated.

Vulnerabilities can occur when the ports of firewall devices are open when they should be closed or automatic updates have accidentally been disabled. PRTG helps you prevent these problems with 24/7 monitoring of your IT security.

icon server

Monitor servers & application performance

Servers are the backbone of your company network. Avoid costly downtime by ensuring that your mail servers, web servers, database servers, virtual servers, and other network components are always up and running.

PRTG makes it easy by keeping a constant eye on your servers and the applications and services that run on them to ensure optimal performance. Plus – unlike other network monitors – PRTG comes with preconfigured sensors for Dell, HPE, Microsoft, IBM, Apache, Exchange, and other hardware endpoints for easy deployment and integration.

What network monitoring best practices looks like in PRTG

Diagnose network issues by continuously tracking network health, availability, and performance. Show uptime, bandwidth utilization, response times, packet loss, latency, CPU usage, and other key performance metrics in real time. Visualize monitoring data in clear network topology maps and dashboards to identify problems more easily. Gain the overview you need to troubleshoot network bottlenecks and other performance issues.

PRTG Screenshot device tree view

Device tree view of the complete monitoring setup

PRTG screenshot map entire it infrastructure

Custom PRTG dashboard for keeping an eye on the entire IT infrastructure

PRTG screenshot graph live data traffic

Live traffic data graph in PRTG

Start network monitoring best practices with PRTG and see how it can make your network more reliable and your job easier.

Free download
PRODUCT OVERVIEW

IT experts agree: Paessler PRTG is a great solution for IT infrastructure monitoring

PCMag

“All-around winning
 network monitor”

IT Brief

“The real beauty of PRTG is the endless possibilities it offers”

ITPro

“PRTG Network Monitor 
is very hard to beat”

3 reasons why PRTG is the network monitoring best practices tool of your choice

icon alarm

Real-time notifications

With network monitoring software like PRTG, keeping an eye on network operations is easy. Just set your individual warning and error thresholds, and PRTG alerts you via SMS, email, push notification, and other methods as soon as a threshold is breached. This way, you can solve potential issues real fast – even before your end users notice.ng powerful?

icon maps

Custom network maps

Complete visibility into your network is a must in every monitoring strategy. With PRTG, you can create your individual dashboards and network maps with just a few clicks using the drag-and-drop map editor. You can even share the maps you build publicly via screen and set granular access rights so people see only the data they need to see.

Icon report

Historical data reports

You need even more network visibility? PRTG comes with a wealth of historical data that you can use to generate in-depth reports for various stakeholders. Analyze performance data and network behavior to identify trends and make informed decisions on hardware, storage, and bandwidth capacity planning, for example.

Explore our preconfigured PRTG sensors for network monitoring

PRTG comes with more than 250 native sensor types for monitoring your entire on-premises, cloud, and hybrid cloud environment out of the box. Check out some examples below!

Port v2

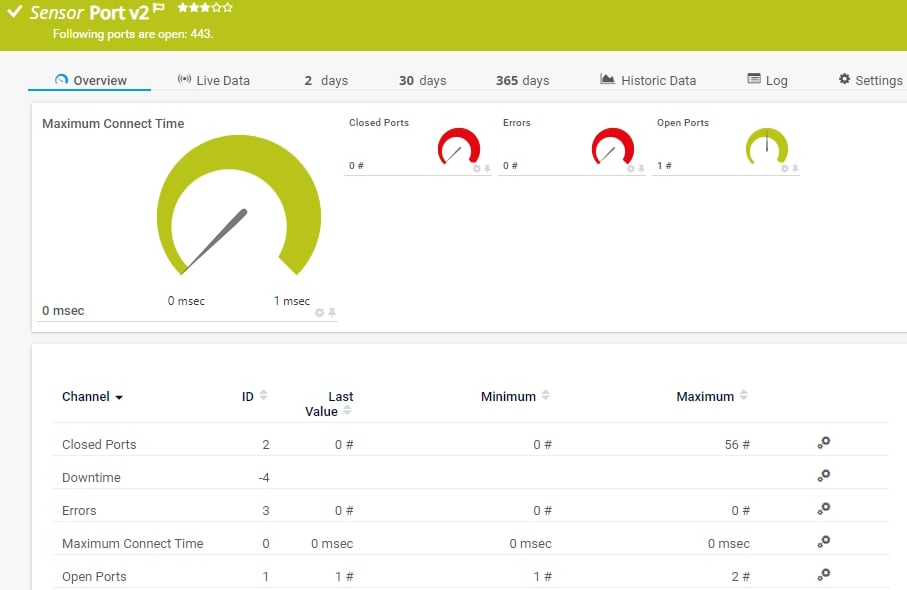
The Port v2 sensor monitors a network service by connecting to one or more of its TCP/IP ports. It can show the following:

  • Number of open and closed ports
  • Number of errors
  • Maximum time until a request to connect to a port was accepted
Port v2
Port v2

SNMP Traffic v2

The SNMP Traffic v2 sensor monitors bandwidth and traffic on a device. It can show the following:

  • Number of incoming and outgoing broadcast, multicast, unicast, and non-unicast packets
  • Number of incoming and outgoing discards and errors
  • Total, incoming, and outgoing traffic
  • Number of incoming, unknown protocols
SNMP Traffic v2
SNMP Traffic v2

Dell PowerVault MDi Physical Disk

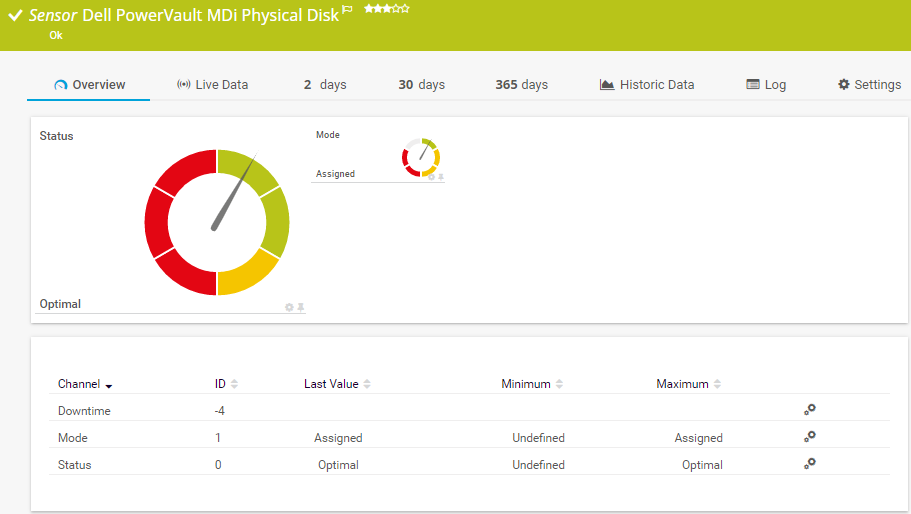
The Dell PowerVault MDi Physical Disk sensor monitors a physical disk on a Dell PowerVault system. It can show the following:

  • Up status: Optimal and Replaced
  • Warning status: None
  • Down status: Failed, Pending Failure, and Undefined
Dell PowerVault MDi Physical Disk

VMware Host Hardware (WBEM)

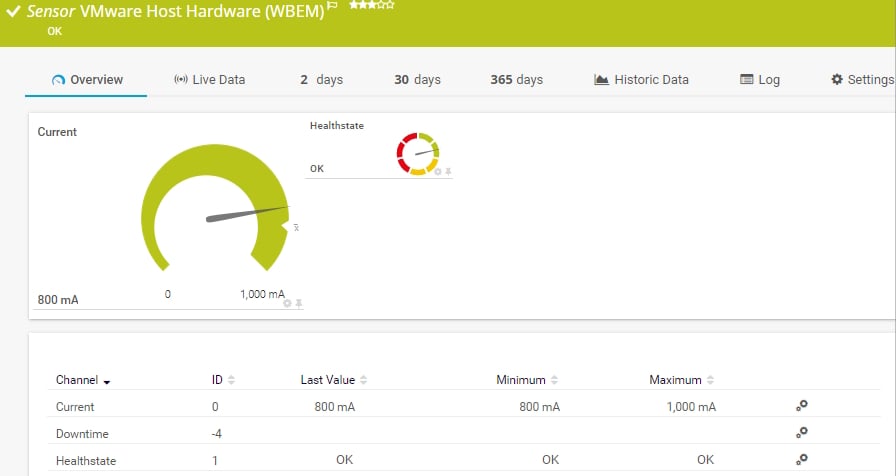
The VMware Host Hardware (WBEM) sensor monitors information about the hardware of an ESXi server using Web-based Enterprise Management (WBEM). It can show the following:

  • The current
  • Health status
  • Average host power status
  • Fan RPM
  • Temperature
Mware Host Hardware (WBEM

See the PRTG Manual for a list of all available sensor types.

PRTG is compatible with all major vendors, products, and systems

compatible with all major vendors, products, and systems

PRTG makes network management as easy as it gets

Custom alerts and data visualization let you quickly identify and preventoutages and other network issues.

Free download
PRODUCT OVERVIEW

”Adopting PRTG has been like going from being in the dark to being in the light. Before, we had limited visibility into what was happening in the infrastructure and in the network. Now, however, thanks to the comprehensive dashboard and real-time notifications, we receive constant updates on the status of facilities and services, and our way of working has gone from passive to proactive.”

Luca Meneghesso, Senior IT infrastructure and Security Specialist
Banca Profilo

”GESAC increasingly focuses on innovation to improve the quality of services offered and the experience of passengers handled every day by Naples Airport. Thanks to PRTG, we finally have unified, automatic, and continuous monitoring of the airport network and can guarantee quick and timely interventions.”

Domenico Ciervo, GESAC ICT Manager
Naples International Airport

”As an international company, PRTG is ideal for us. If something went down half way across the world, we wouldn’t be woken up – we can rely on PRTG to identify the problem and alert us before it occurs – enabling the right person, in the right time zone to resolve the problem. At the end of the day, if we’re to provide an internal network experience for our employees that meets expectations, we need a tool like PRTG to be successful.”

Barry Kelly, Systems Engineer
Skyscanner

“I would recommend PRTG because it has helped us significantly improve service uptime by highlighting important alerts that would otherwise result in a system failure or service disruption if action was not taken. Thanks to PRTG, we can ensure that The Ritz London’s network and IT systems are five-star, just like the hotel.”

Richard Isted, IT Manager
The Ritz London

Your network monitoring system at a glance – even on the go


Set up PRTG in minutes and use it on almost any mobile device.

device overview
Gartner peer insights

“Excellent tool for detailed monitoring. Alarms and notifications work greatly. Equipment addition is straight forward and server initial setup is very easy. ...feel safe to purchase it if you intend to monitor a large networking landscape.”

Read the complete review at Gartner Peer Insights

Create innovative solutions with Paessler’s IT partners

Partnering with innovative IT vendors, Paessler unleashes synergies to create
new and additional benefits for joined customers.

Rittal

Rittal

IT that works constitutes a business-critical basis for a company's success. Availability and security must be defined for the respective purpose and closely monitored – by OT and IT alike.

Read more
NetBrain

NetBrain

Integrating monitoring results from PRTG into NetBrain maps makes the foundation for network automation.

Read more
ScriptRunner

ScriptRunner

With ScriptRunner Paessler integrates a powerful event automation platform into PRTG Network Monitor.

Read more

Find the root cause of the problem with our PRTG network monitoring solution

Real-time notifications mean faster troubleshooting so that you can act before more serious issues occur.

Free download
PRODUCT OVERVIEW
Paessler PRTG

Paessler PRTG

Network Monitoring Software – Version 24.4.102.1351 (November 12th, 2024)

Hosting icon

Hosting

Download for Windows and cloud-based version PRTG Hosted Monitor available

Languages icon

Languages

English, German, Spanish, French, Portuguese, Dutch, Russian, Japanese, and Simplified Chinese

test

Monitor everything

Network devices, bandwidth, servers, applications, virtual environments, remote systems, IoT, and more

test

Pricing

Choose the PRTG Network Monitor subscription that's best for you

Discover more monitoring insights and stories

Resources Solution

Solutions for all your monitoring needs

  • System requirements for Paessler PRTG monitoring software
  • The monitoring solution for all areas of IT!
  • WAN monitoring with PRTG: A hub for distributed networks
Resources Content

Powerful stories from the monitoring world

  • The ultimate guide to boosting your PRTG performance
  • Disabling ICMP and SNMP won’t increase security, but will impact network monitoring
  • Get more visibility of VMware ESXi: Metrics you should be monitoring
Resources Solutions

Resources to master your monitoring challenges

  • Exchange Server Monitoring - What to monitor?
  • Best practice public internet access
  • Are there use cases and best practices for PRTG libraries?

Network Monitoring Best Practices: FAQ


What is the recommended protocol for network monitoring?

The recommended protocol for network monitoring typically includes a combination of SNMP (Simple Network Management Protocol), NetFlow/IPFIX, Syslog, and ICMP (Internet Control Message Protocol). These protocols serve different purposes and are often used together for comprehensive monitoring.

  • SNMP (Simple Network Management Protocol): SNMP is widely used for collecting and managing information about network devices such as routers, switches, servers, and printers.
  • NetFlow/IPFIX (Internet Protocol Flow Information Export): NetFlow (by Cisco) and IPFIX (an IETF standard based on NetFlow) are used for monitoring and analyzing IP network traffic by collecting flow data.
  • Syslog (System Logging Protocol): Syslog is used to transmit log or event messages from network devices to a centralized Syslog server for logging and analysis.
  • ICMP (Internet Control Message Protocol): ICMP is used for basic network troubleshooting and monitoring, especially to check the availability and responsiveness of devices.
What is the best way to monitor your network?

The best way to monitor your network effectively involves using a combination of tools, protocols, and best practices to cover all aspects of network performance, security, and reliability. Here’s a structured approach:

  • Determine goals: Start by defining what you need to monitor. Common goals include tracking performance, identifying security threats, maintaining uptime, and managing capacity.
  • Identify key metrics:
    • Performance: Bandwidth usage, latency, packet loss, error rates, CPU/memory usage on network devices.
    • Availability: Uptime and downtime, device availability, network reachability.
    • Traffic: Who is using the network, what applications or protocols are consuming bandwidth, and when.
    • Security: Unusual traffic patterns, access attempts, security alerts.
  • Define thresholds: Establish thresholds for key metrics to identify when a device or network segment is performing outside of normal parameters.
  • Set up alerts: Configure alerts for critical issues. Use escalation protocols to notify the appropriate teams based on the severity of alerts.
  • Create dashboards: Use dashboards to create visual overviews of network health, traffic, and device status.
  • Generate reports: Schedule reports that analyze trends in performance, usage, and security incidents.
  • Device updates: Regularly update network devices with firmware and security patches to minimize vulnerabilities.
  • Network audits: Periodic audits help validate network configurations, security settings, and monitoring accuracy.
  • Trend analysis: Use historical data to identify trends in bandwidth usage, device performance, and security incidents.
  • Capacity planning: Use traffic data to anticipate and prevent bottlenecks by planning for additional resources.
How do you monitor the effectiveness of a network system?

Monitoring the effectiveness of a network system involves evaluating how well the network meets performance, reliability, and security objectives. This can be done by tracking key metrics, setting benchmarks, analyzing trends, and conducting regular assessments. Here’s a step-by-step approach:

  1. Define objectives with clear KPIs.
  2. Use a combination of monitoring tools and protocols to gain complete visibility.
  3. Set thresholds and alerts for proactive management.
  4. Analyze performance trends for capacity planning.
  5. Evaluate security measures for network protection.
  6. Regularly assess network health and conduct audits for optimization.
  7. Report and review with stakeholders to ensure goals are being met.
What’s included in the free edition of PRTG?

With our free network monitoring tool, you get:

  • A freeware monitoring solution for up to 100 sensors for life
  • Monitoring of hardware, software, network performance, data traffic included
  • Free alerting, reporting, and mapping features

With the freeware edition of PRTG, you can get started with network monitoring in a matter of minutes. Our auto-discovery function detects all the devices within a given IP address range and automatically incorporates them into your monitoring environment.

What is the price of the paid version of PRTG? What does it include?

PRTG’s flexible subscription licensing makes it easy to scale as needed, based on the number of sensors in use. After your 30-day free trial of the unlimited version of PRTG, you can still use the free version with 100 free sensors. Review our pricing

What is a sensor in PRTG?

In PRTG, “sensors” are the basic monitoring elements. One sensor usually monitors one measured value in your network, for example the traffic of a switch port, the CPU load of a server, or the free space on a disk drive. On average, you need about 5-10 sensors per device or one sensor per switch port.

We asked: would you recommend PRTG? Over 95% of our customers say yes!

Paessler conducted trials in over 600 IT departments worldwide to tune its network monitoring software closer to the needs of sysadmins. The result of the survey: over 95% of the participants would recommend PRTG – or already have.

recommendation

Still not convinced?

Love

More than 500,000 sysadmins love PRTG

Paessler PRTG is used by companies of all sizes. Sysadmins love PRTG because it makes their job a whole lot easier.

PRTG

Monitor your entire IT infrastructure

Bandwidth, servers, virtual environments, websites, VoIP services – PRTG keeps an eye on your entire network.

test

Try Paessler PRTG for free

Everyone has different monitoring needs. That’s why we let you try PRTG for free.

PRTG Logo

Start network monitoring best practices with PRTG and see how it can make your network more reliable and your job easier.

Free download
PRODUCT OVERVIEW

Products

  • Paessler PRTG
    Paessler PRTGMonitor your whole IT infrastructure
    • PRTG Network Monitor
    • PRTG Enterprise Monitor
    • PRTG Hosted Monitor
    • PRTG extensions
      Extensions for Paessler PRTGExtend your monitoring to a new level
  • Icon Features
    FeaturesExplore all monitoring features

Monitoring with PRTG

  • Network monitoring
  • Bandwidth monitoring
  • SNMP monitoring
  • Network mapping
  • Wi-Fi monitoring
  • Server monitoring
  • Network traffic analyzer
  • NetFlow monitoring
  • Syslog server

Useful Links

  • PRTG Manual
  • Knowledge Base
  • Customer Success Stories
  • About Paessler
  • Subscribe to newsletter
  • PRTG Support
  • PRTG Consulting

Contact

Paessler GmbH
Thurn-und-Taxis-Str. 14, 
90411 Nuremberg 
Germany

info@paessler.com

+49 911 93775-0

  • Contact us
©2025 Paessler GmbHTerms & ConditionsPrivacy PolicyImprintReport VulnerabilityDownload & InstallSitemap
404 - Page not found 404 - Page not found 404 - Page not found