• Company
    • About Us
    • Case Studies
    • Press Center
    • Events
    • Careers
    • Blog
    • Contact us
  • Contact us
  • Login
 
  • English
    • Deutsch
    • Español
    • Français
    • Italiano
    • Português
Paessler
                    - The Monitoring Experts
  • Products
    • Paessler PRTG
      Paessler PRTGMonitor your whole IT infrastructure
      • PRTG Network Monitor
      • PRTG Enterprise Monitor
      • PRTG Hosted Monitor
      • PRTG extensionsExtensions for Paessler PRTGExtend your monitoring to a new level
    • Icon Features
      FeaturesExplore all monitoring features
      • Maps & dashboards
      • Alerts & notifications
      • Multiple user interfaces
      • Distributed monitoring
      • Customizable reporting
  • Solutions
    • Industries
      IndustriesMonitor various industry sectors
      • Industrial
      • Healthcare
      • Data Center
      • Education
      • Finance
      • Government
    • IT Topics
      IT TopicsMonitor all areas of IT
      • Network Monitoring
      • Bandwidth Monitoring
      • SNMP Monitor
      • Network Mapping
      • WiFi Monitoring
      • Server Monitoring
  • Pricing
  • Resources
    • Getting Started
      Getting StartedModules for self-paced learning
    • How-to Guides
      How-to GuidesGet the most out of PRTG
    • Videos & Webinars
      Videos & WebinarsLearn from Paessler experts
    • IT  Knowledge
      IT KnowledgeExpand your IT knowledge
    • PRTG Manual
      PRTG ManualFull documentation
    • Knowledge Base
      Knowledge BaseShare community knowledge
    • PRTG Sensor Hub
      PRTG Sensor HubGet sensors, scripts & templates
    • Trainings
      PRTG TrainingLearn how to work with PRTG
  • Partners
    • icon star
      New Partners and MSPBecome a new partner or MSP
    • icon partner
      Partner PortalLog in to your partner account
    • Deal Registration
      Deal RegistrationRegister your sales opportunities
    • icon search
      Find a PartnerFind partners selling Paessler products
    • icon technology
      Technology AlliancesSee Paessler technology partnerships
  • Company
    • About Us
    • Case Studies
    • Press Center
    • Events
    • Careers
    • Blog
    • Contact us
  • Contact us
  • Login
  • English
    • Deutsch
    • Español
    • Français
    • Italiano
    • Português
  • Get a quote
  • Free trial
  1. Home>
  2. IT Topics>
  3. Industrial IT>
  4. MQTT Monitoring
PRTG Logo

MQTT Monitoring with PRTG

Maximize IIoT efficiency & prevent failures in your production processes

  • Avoid malfunctions or failures during the production process
  • Get a combined overview of your IT and OT networks
  • Identify bottlenecks in your production or building automation
Free download
product overview

Paessler PRTG is trusted by 500,000 users worldwide

Siemens
Truma
Bosch
rexroth
SMS group

PRTG MQTT monitoring: What you will find on this page

Table of content
  • 5 reasons why to choose PRTG as your MQTT monitoring tool
  • What MQTT monitoring looks like in PRTG
  • Explore our preconfigured PRTG sensors for MQTT monitoring
  • MQTT Monitoring: FAQ

PRTG makes MQTT broker monitoring as easy as it gets

Custom alerts and data visualization let you quickly identify and prevent MQTT traffic and other performance issues.

Free download
PRODUCT OVERVIEW

5 reasons why to choose PRTG as your MQTT monitoring tool

As Message Queuing Telemetry Transport (MQTT) has become one of the most important protocols in the IIoT and IoT world, it should also be a key component of your monitoring concept. The solution: Paessler PRTG, your all-in-one monitoring tool that combines IT, industrial IoT, and OT network monitoring in a single pane of glass.

View from a central dashboard

Do away with checking IT and IoT devices with multiple tools and on multiple dashboards. With MQTT integration in PRTG, you get a combined overview of your classic IT and MQTT devices – all in one place.

What’s more: The PRTG Map Editor functionality lets you easily create custom dashboards using drag and drop so that you have the status of all your critical devices and applications at a glance.

Monitor converged IT/OT networks

In industrial IT environments, many OT network components such as PLCs, industrial PCs, SCADA systems, HMIs, or MES cannot be monitored with traditional IT monitoring protocols.

PRTG’s MQTT monitoring, in combination with your smart industrial gateways, easily brings OT network data into your IT monitoring concept.

Benefit from out-of-the-box integrations

Beyond support for all classic IT standards, PRTG offers a RESTful API, JSON, and MQTT support out of the box.

Not to mention OPC UA and SCADA integration to easily monitor shop floors, IoT devices, and other IT devices, applications, and services that don't use common IT technologies.

Get full MQTT server monitoring

No need to worry whether a connection to the MQTT broker – or server – can be established, or if it accepts messages or forwards them to a matching subscriber at all.

With PRTG’s preconfigured sensor types for monitoring MQTT, you can keep an eye on the availability and connection time of your MQTT broker 24/7.

Receive custom alerts & notifications

Set it – that is, thresholds – and forget it. With PRTG’s real-time alerts and customizable notification templates, you’re always notified in time if there is an issue in your infrastructure.

Use MQTT notifications, for example, to forward alerts, warnings, or any other information to a third-party system of your choice that can subscribe to MQTT topics.

What MQTT monitoring looks like in PRTG

Diagnose network issues by continuously tracking your industrial IT and OT networks. Show MQTT connection status and quality, message throughput and latency, topic and resource usage, and other key metrics in real time. Visualize monitoring data in clear graphs and dashboards to identify problems more easily. Gain the overview you need to troubleshoot all kinds of MQTT traffic, health, and performance issues.

PRTG Screenshot device tree view

Device tree view of the complete monitoring setup

PRTG screenshot map industrial monitoring

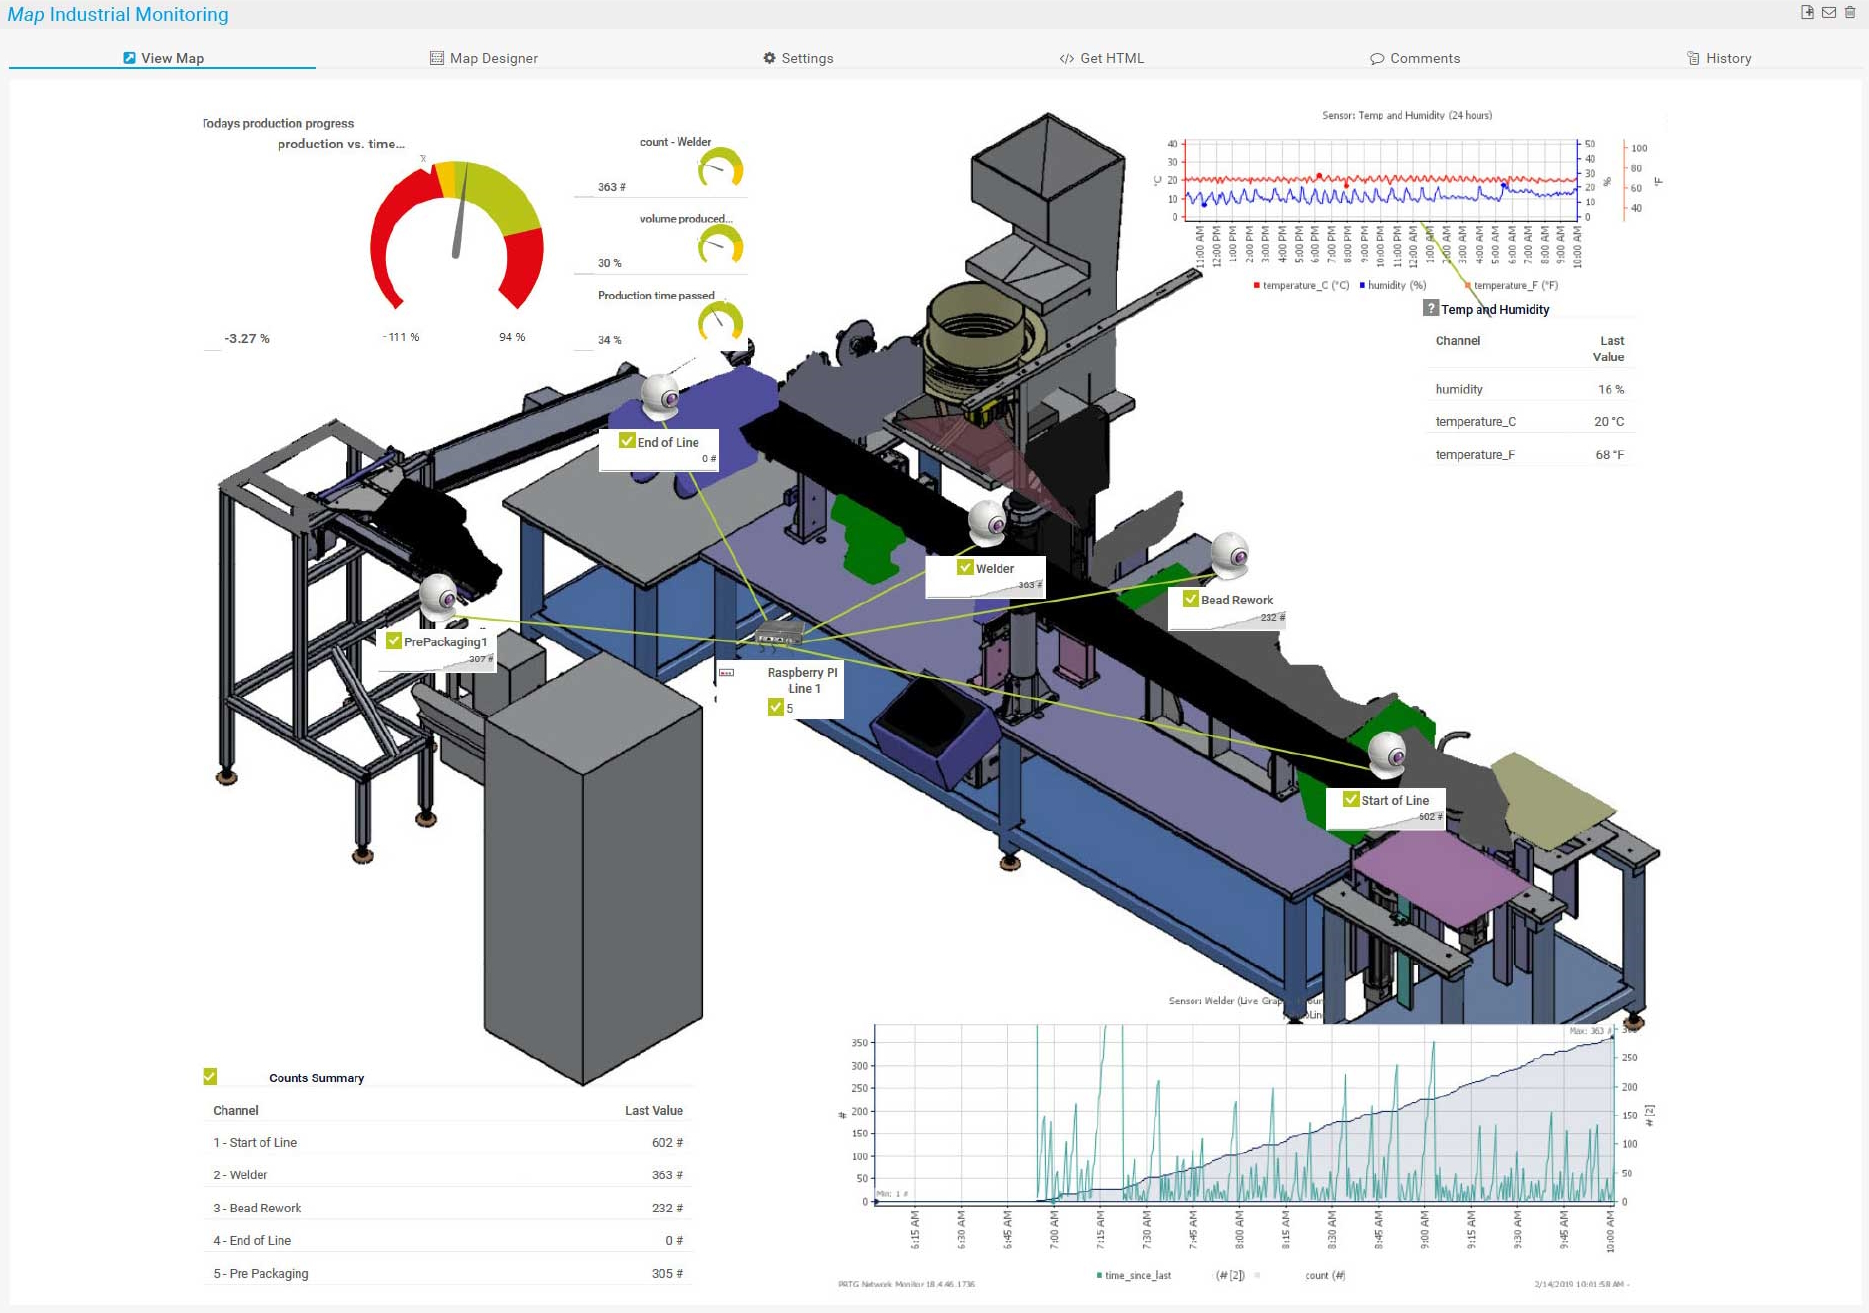
Custom industrial monitoring map in PRTG

Map Industrial Orchestra DE

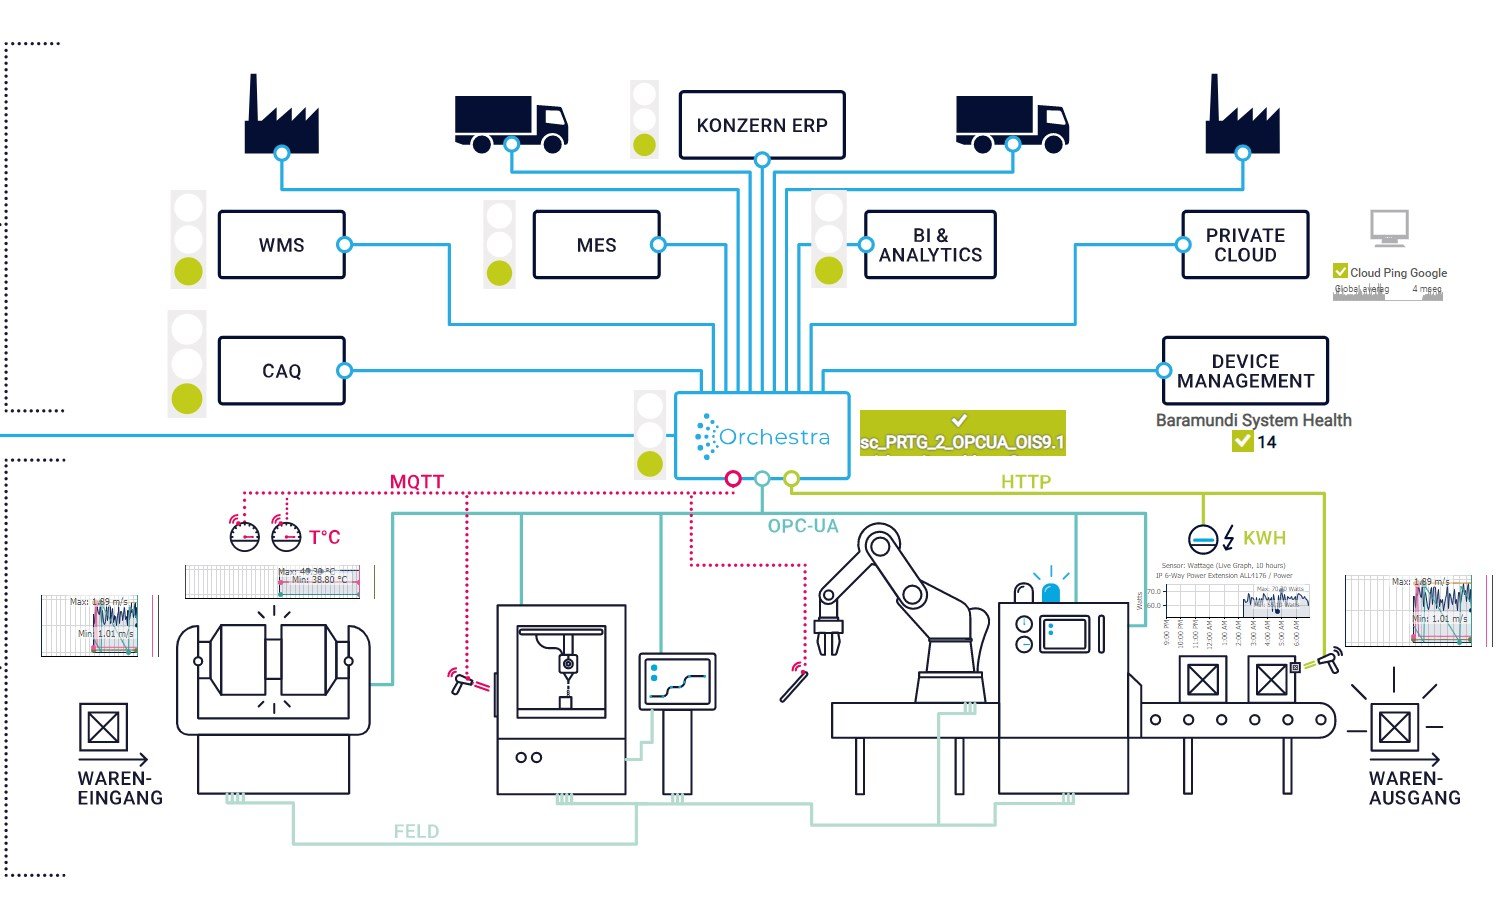
Orchestra map in PRTG

Start monitoring using the MQTT protocol with PRTG and see how it can make your network more reliable and your job easier.

Free download
PRODUCT OVERVIEW

An award-winning extension for Paessler PRTG to bridge IT and OT, as voted by readers

computer automation

Awarded 3rd place in the 
Software & IT category

ned innovation award

Winner in the Software & 
Computers category

Explore our preconfigured PRTG sensors for MQTT monitoring

PRTG comes with more than 250 native sensor types for monitoring your entire on-premises, cloud, and hybrid cloud environment out of the box. Check out some examples below!

MQTT Round Trip

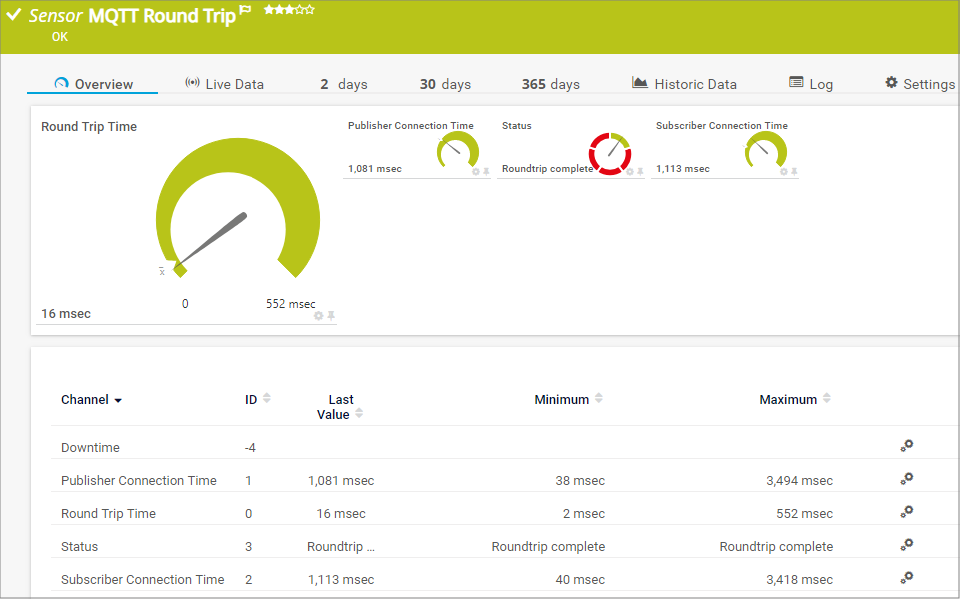
The MQTT Round Trip sensor monitors the availability of a Message Queue Telemetry Transport (MQTT) broker (server), connects to the broker as a publishing and subscribing client, and sends the data packets using a predefined topic. It can show the following:

  • Time it takes the publisher to connect
  • Time it takes the subscriber to connect
  • Round trip time (RTT) of the message (after both publisher and subscriber connected)
  • Round trip status
MQTT Round Trip
MQTT Round Trip

MQTT Statistics

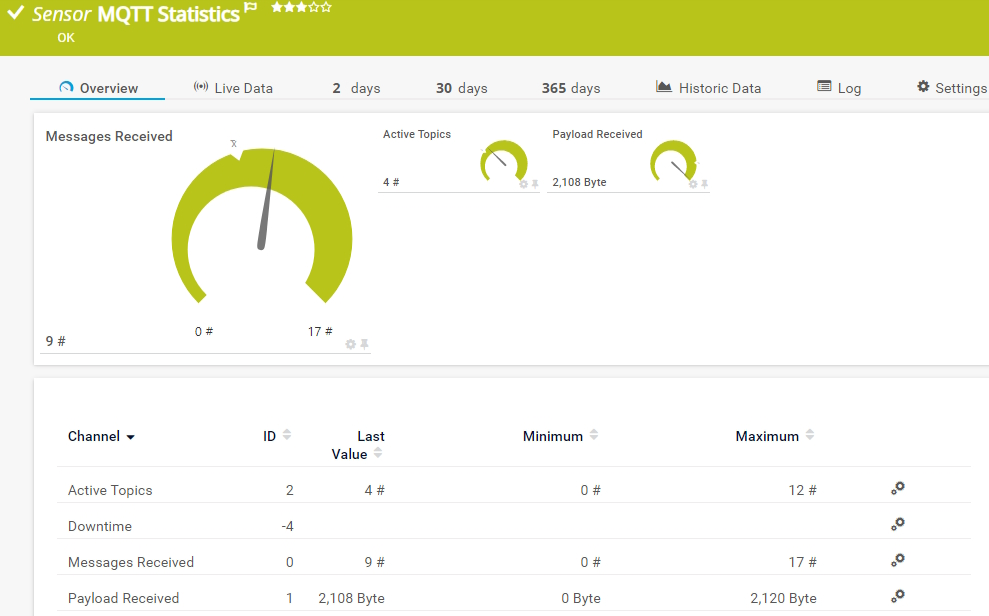
The MQTT Statistics sensor monitors a Message Queue Telemetry Transport (MQTT) topic. It can show the following:

  • Number of active MQTT topics
  • Number of messages received since the last scan
  • Payload received
MQTT Statistics
MQTT Statistics

MQTT Subscribe Custom

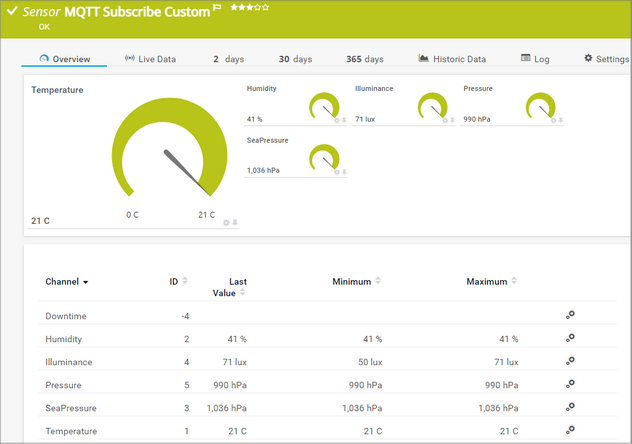
The MQTT Subscribe Custom sensor subscribes to a Message Queue Telemetry Transport (MQTT) topic and monitors up to ten numeric values from the received JSON data. It can show the following:

  • Downtime
  • Custom numeric values
MQTT Subscribe Custom

See the PRTG Manual for a list of all available sensor types.

PRTG is compatible with all major vendors, products, and systems

compatible with all major vendors, products, and systems

PRTG makes MQTT broker monitoring as easy as it gets

Custom alerts and data visualization let you quickly identify and prevent MQTT traffic and other performance issues.

Free download
PRODUCT OVERVIEW

“PRTG has become an essential part of the entire plant production process, from planning to acceptance by the customer. So much so that we are currently toying with the idea of expanding our portfolio to offer support for plants, even after they are operational.”

Frank Schweisfurth
SMS group

“We have known PRTG for many years. We have selected this solution because it integrates natively into the industrial operational technology environments that we offer to our customers in the region.”

Miguel Ángel López Ávila, General Manager
SE3

“We appreciate the flexibility of PRTG and how it grows together with the company, supporting our needs to also digitalize the factory floor and monitor not only standard IT infrastructure but also factory equipment.”

Sandeep Rai, Network and Security Team Lead
Nobia AB

“In the past, the enterprise and the industrial network were completely separated with very different requirements, such as security versus productivity. We see that within OT, monitoring is not widely used yet for several reasons, but processes are depending on IT systems more and more. The need for a reliable OT network is growing rapidly, and that’s where PRTG comes in.”

Pascal Vercammen, Digitalization & IT Department Manager
Process Automation Solutions

Your MQTT monitor at a glance – even on the go

PRTG is set up in a matter of minutes and can be used on a wide variety of mobile devices.

device overview
Gartner peer insights

“Excellent tool for detailed monitoring. Alarms and notifications work greatly. Equipment addition is straight forward and server initial setup is very easy. ...feel safe to purchase it if you intend to monitor a large networking landscape.”

Read the complete review at Gartner Peer Insights

Create innovative solutions with Paessler’s IT partners

Partnering with innovative IT vendors, Paessler unleashes synergies to create
new and additional benefits for joined customers.

NetBrain

NetBrain

Integrating monitoring results from PRTG into NetBrain maps makes the foundation for network automation.

Read more
Rittal

Rittal

IT that works constitutes a business-critical basis for a company's success. Availability and security must be defined for the respective purpose and closely monitored – by OT and IT alike.

Read more
ScriptRunner

ScriptRunner

With ScriptRunner Paessler integrates a powerful event automation platform into PRTG Network Monitor.

Read more

Find the root cause of the problem with our PRTG MQTT monitoring solution

Real-time notifications mean faster troubleshooting so that you can act before more serious issues occur.

Free download
PRODUCT OVERVIEW
Paessler PRTG

Paessler PRTG

Network Monitoring Software – Version 25.2.106.1114 (May 05th, 2025)

Hosting icon

Hosting

Download for Windows and cloud-based version PRTG Hosted Monitor available

Languages icon

Languages

English, German, Spanish, French, Portuguese, Dutch, Russian, Japanese, and Simplified Chinese

test

Monitor everything

Network devices, bandwidth, servers, applications, virtual environments, remote systems, IoT, and more

test

Pricing

Choose the PRTG Network Monitor subscription that's best for you

MQTT Monitoring: FAQ


What is MQTT?

MQTT (Message Queuing Telemetry Transport) is a lightweight messaging protocol. It is used in cases where a small code footprint is needed while bandwidth resources are limited. It is primarily used for machine-to-machine (M2M) communication or Internet of Things types of MQTT connections. MQTT 5 is the latest version of the MQTT protocol.

MQTT supports different levels of QoS and Last Will and Testament (LWT). It can use SSL/TLS to secure the communication channel between the client and the broker. MQTT also supports various authentication mechanisms (username/password, tokens) and can enforce authorization policies to control access to topics.

How does MQTT work?

Devices send MQTT messages to each other via:

  • Topics: These are a way of categorizing the types of messages that are sent. If a sensor measures temperature, for example, the topic can be defined as “TEMP”, and the sensor sends messages out labelled as “TEMP”.
  • Publishers: Devices can be configured to send out messages containing data. Using the temperature example, the sensor measuring temperature publishes this data.
  • Subscribers: Devices or systems can be configured to receive only messages of a specific topic. They can also have subscriptions of multiple topics.
  • Broker: This is the server that is at the center of MQTT communication. It transmits the published messages to servers or MQTT clients that have subscribed to specific topics. An example is the open-source message broker Mosquitto.
Infographic MQTT Broker
What is MQTT monitoring?

MQTT monitoring involves overseeing the performance, reliability, and security of MQTT-based messaging systems. This includes tracking the behavior of MQTT brokers, clients, and the overall message flow within the system. Effective monitoring ensures the health and efficiency of MQTT deployments, particularly in mission-critical applications such as IoT.

Use cases of MQTT monitoring include:

  • Broker monitoring:
    • Connection status: Track the status of client connections, including successful connections, disconnections, and reconnections.
    • Message throughput: Monitor the rate of messages being published and delivered.
    • Resource usage: Keep an eye on CPU, memory, and network usage of the broker to prevent overload and ensure scalability.
    • Error rates: Monitor error logs and rates to detect issues like failed receiving messages or authentication errors.
  • Client monitoring:
    • Connection quality: Track connection stability, including connection duration and frequency of reconnections.
    • Message latency: Measure the time it takes for messages to be delivered from publishers to subscribers.
  • Message flow monitoring:
    • Topic usage: Monitor which topics are being used, how frequently they are published to or subscribed to, and the size of the messages.
    • QoS levels: Track the usage and performance of different Quality of Service levels.
    • Retained messages: Monitor the state and delivery of retained messages.
Does PRTG support other industrial protocols?

Paessler PRTG is a comprehensive monitoring tool that supports a wide range of industrial standards and protocols to monitor various aspects of industrial IT infrastructure, including:

  • Modbus TCP
  • OPC UA (Open Platform Communications Unified Architecture)
  • IPMI and Redfish

It also comes with preconfigured sensor types for manufacturers such as Rittal or Beckhoff.

What is a sensor in PRTG?

In PRTG, “sensors” are the basic monitoring elements. One sensor usually monitors one measured value in your network, for example the traffic of a switch port, the CPU load of a server, or the free space on a disk drive. On average, you need about 5-10 sensors per device or one sensor per switch port.

We asked: would you recommend PRTG? Over 95% of our customers say yes!

Paessler conducted trials in over 600 IT departments worldwide to tune its network monitoring software closer to the needs of sysadmins. The result of the survey: over 95% of the participants would recommend PRTG – or already have.

recommendation

Still not convinced?

Love

More than 500,000 sysadmins love PRTG

Paessler PRTG is used by companies of all sizes. Sysadmins love PRTG because it makes their job a whole lot easier.

PRTG

Monitor your entire IT infrastructure

Bandwidth, servers, virtual environments, websites, VoIP services – PRTG keeps an eye on your entire network.

test

Try Paessler PRTG for free

Everyone has different monitoring needs. That’s why we let you try PRTG for free.

PRTG Logo

Start MQTT monitoring with PRTG and see how it can make your network more reliable and your job easier.

Free download
PRODUCT OVERVIEW

Products

  • Paessler PRTG
    Paessler PRTGMonitor your whole IT infrastructure
    • PRTG Network Monitor
    • PRTG Enterprise Monitor
    • PRTG Hosted Monitor
    • PRTG extensions
      Extensions for Paessler PRTGExtend your monitoring to a new level
  • Icon Features
    FeaturesExplore all monitoring features

Monitoring with PRTG

  • Network monitoring
  • Bandwidth monitoring
  • SNMP monitoring
  • Network mapping
  • Wi-Fi monitoring
  • Server monitoring
  • Network traffic analyzer
  • NetFlow monitoring
  • Syslog server

Useful Links

  • PRTG Manual
  • Knowledge Base
  • Customer Success Stories
  • About Paessler
  • Subscribe to newsletter
  • PRTG Support
  • PRTG Consulting

Contact

Paessler GmbH
Thurn-und-Taxis-Str. 14, 
90411 Nuremberg 
Germany

info@paessler.com

+49 911 93775-0

  • Contact us
©2025 Paessler GmbHTerms & ConditionsPrivacy PolicyImprintReport VulnerabilityDownload & InstallSitemap
404 - Page not found 404 - Page not found 404 - Page not found