Custom alerts and data visualization let you quickly identify and prevent bottlenecks or downtime.
Is your Redis slowing down your applications? With PRTG, you can keep your Redis fast and reliable.
Redis powers many modern applications that need lightning-fast data access. But when Redis slows down, your whole system suffers. PRTG gives you the tools to monitor your Redis servers around the clock, allowing you to stop problems before they start.
With PRTG, you'll see real-time data on critical Redis metrics like memory usage, latency, and connected clients. You'll know immediately if something's wrong, and you can fix it fast. Set up custom alerts, and your team can jump into action at the first sign of trouble.

PRTG keeps an eye on all the important Redis metrics. You can monitor memory usage, latency, connected clients, and more. PRTG even tracks things like memory fragmentation and keyspace activity. You'll have a complete picture of your Redis health, allowing you to improve performance and stop issues before they happen.
Stay informed about your Redis infrastructure with PRTG's customizable alerting system. Create notifications for different scenarios, whether it's high memory usage, slow response times, or too many clients – you will know right away. Choose how you want to be notified - email, SMS, or push notifications, so you and your team can quickly respond to any Redis problem.
PRTG gives you the details you need to solve Redis problems. Check throughput, monitor the number of operations per second, and track the hit rate of your Redis cache. You can also see how your data structure usage, TTL (Time To Live) settings, and eviction policies are working. With these insights, you can fine-tune your Redis for top performance.
No matter where your Redis runs - on-site or in the cloud (AWS, Azure, or Google Cloud) – thanks to its flexible API PRTG it’s easy to integrate your network monitor into your existing infrastructure. Monitor multiple Redis instances at once, keep tabs on Redis clusters, and watch over Redis Enterprise deployments. As your Redis use grows, PRTG grows with you, giving you consistent monitoring across your whole Redis ecosystem.
Diagnose network issues by continuously tracking your Redis instances. Show memory usage, latency, and other key metrics in real time. Visualize monitoring data in clear graphs and dashboards to identify problems more easily. Gain the overview you need to troubleshoot Redis server issues and optimize performance.

Device tree view of the complete monitoring setup

Custom PRTG dashboard for keeping an eye on the entire IT infrastructure

Live traffic data graph in PRTG
“All-around winning
network monitor”
“The real beauty of PRTG is the endless possibilities it offers”
“PRTG Network Monitor
is very hard to beat”
PRTG gives you a complete view of your Redis instances, helping you to run them efficiently and reliably.
Track the essentials: memory usage, latency, and throughput. You'll see slowdowns as they happen and can act fast. Monitor your memory limits and fragmentation with PRTG to optimize your resources, all while you can easily keep an eye on response times and operations per second, giving you a clear picture of your Redis database performance.
To support high availability, monitor your Redis replication with PRTG, to observe connected slaves and possible replication lag. Track the number of clients and client connections, to help your team manage load and avoid overload situations. Monitor blocked clients and quickly identify and resolve issues that might cause delays or failures. With this thorough monitoring your Redis setup will be able to handle your application's demands.
PRTG Redis monitoring constantly checks the health of your data structures and key usage, giving you insights into keyspace hits and misses. It monitors the total number of keys in the database and tracks Time To Live (TTL) as well as expiration settings. You can also watch eviction counts and policies, helping you can fine-tune your Redis configuration to handle memory pressure and maintain efficient memory usage and data freshness.
Don't just watch Redis - monitor the whole system it runs on. Track Redis process CPU usage and various operating system metrics, including those specific to Linux environments. Get alerts on config changes that might affect performance while tracking Pub/Sub channels and patterns, giving you insights in your messaging system. With PRTG, you get complete visibility into your entire Redis setup.
PRTG comes with more than 250 native sensor types for monitoring your entire on-premises, cloud, and hybrid cloud environment out of the box. Check out some examples below!
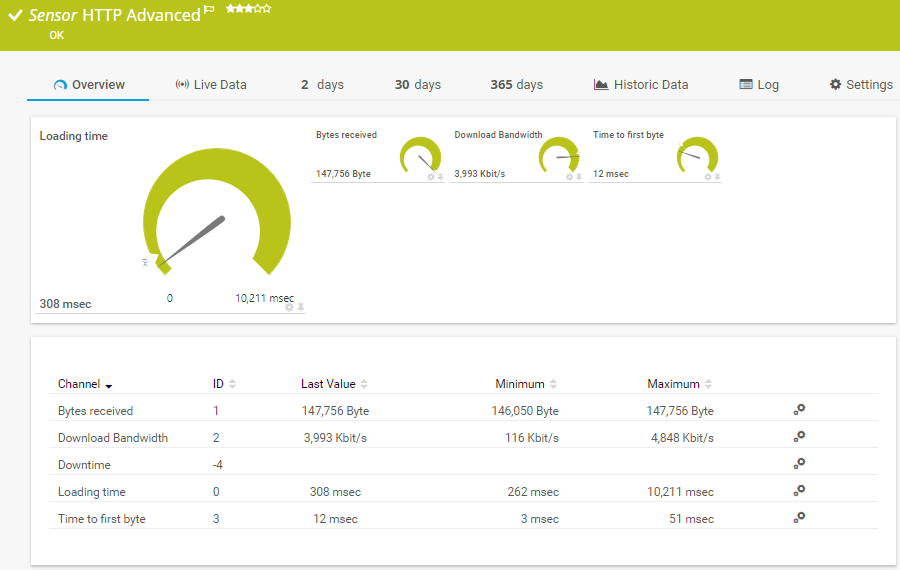
The HTTP Advanced sensor monitors the source code of a web page using HTTP. It supports authentication, content checks, and other advanced parameters. It can show the following:
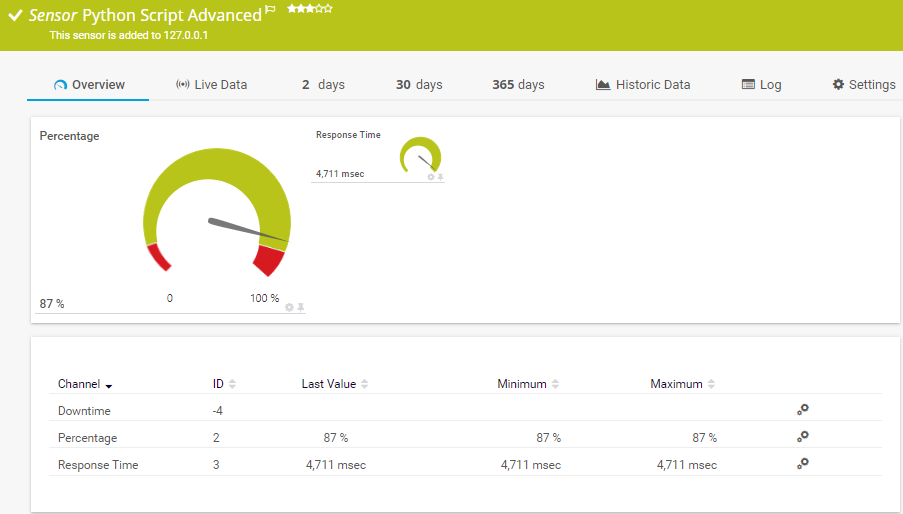
The Python Script Advanced sensor executes a Python script on the probe system. This option is available as part of the PRTG API. It can show the following:
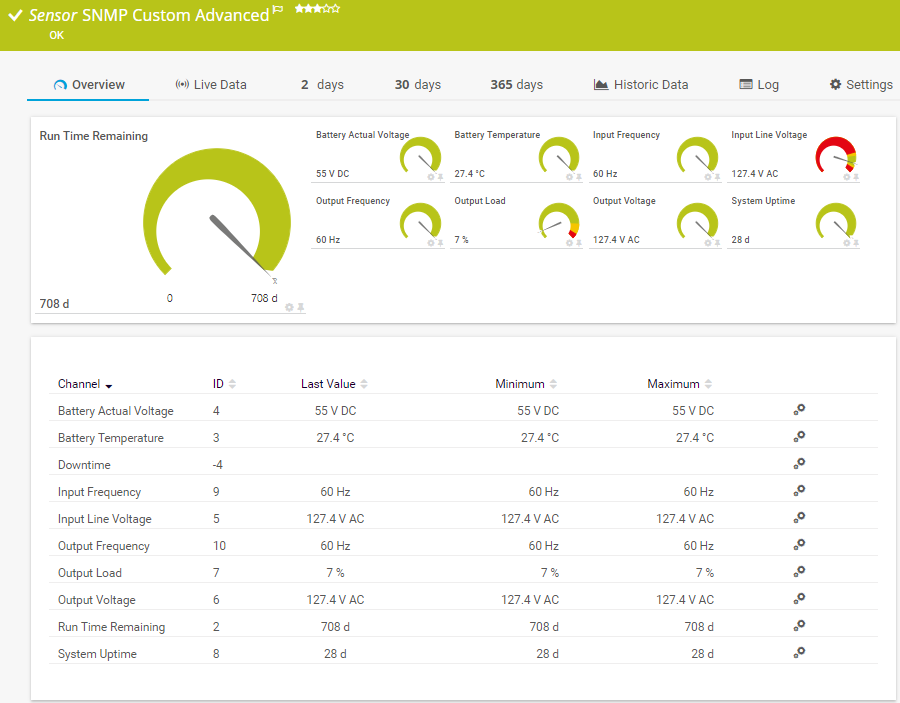
The SNMP Custom Advanced sensor monitors numeric values returned for object identifiers (OID). It can show the following:
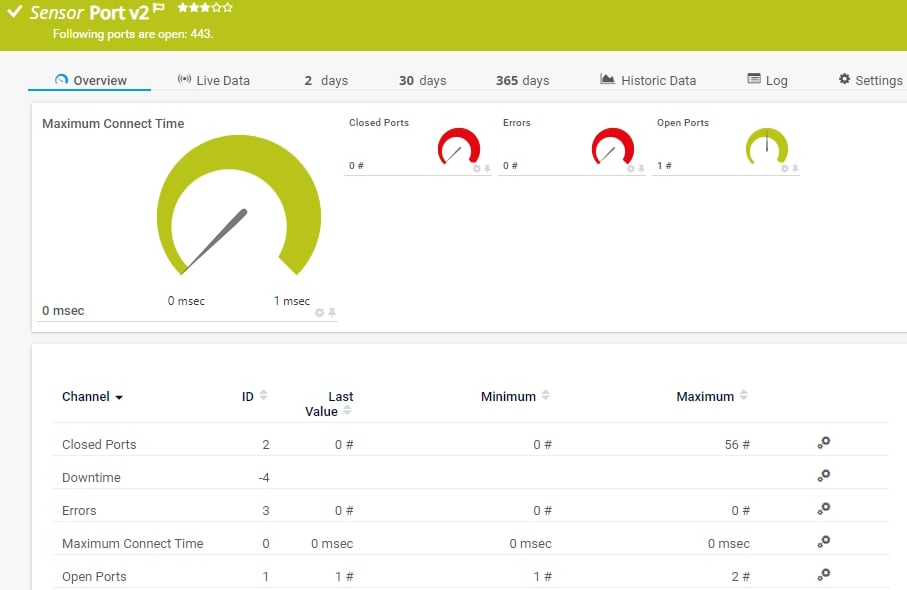
The Port v2 sensor monitors a network service by connecting to one or more of its TCP/IP ports. It can show the following:
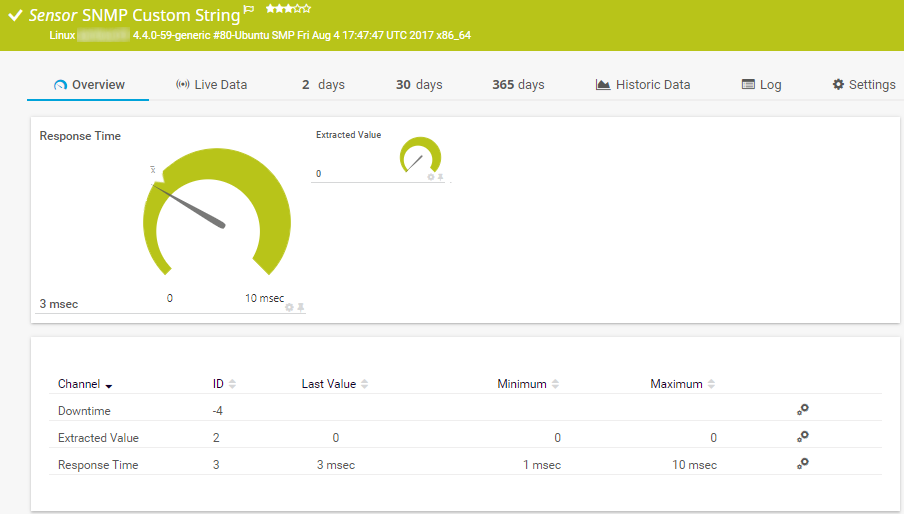
The SNMP Custom String sensor monitors a string returned by a specific object identifier (OID). It can check for keywords. It can show the following:
See the PRTG Manual for a list of all available sensor types.

Custom alerts and data visualization let you quickly identify and prevent database performance issues.
PRTG is set up in a matter of minutes and can be used on a wide variety of mobile devices.

Partnering with innovative IT vendors, Paessler unleashes synergies to create
new and additional benefits for joined customers.
Combining their tools to a powerful solution for advanced analysis and automation, KnowledgeRiver and Paessler enable IT teams to ensure best performance for their infrastructure and networks.
By integrating PRTG with Martello iQ, you can add a fast analytics layer to improve uptime, visualize your IT environment, and integrate all of your IT systems into a single pane of glass.
UVexplorer integrates tightly with PRTG to bring fast and accurate network discovery, detailed device inventory, and automatic network mapping to the PRTG platform.
Real-time notifications mean faster troubleshooting so that you can act before more serious issues occur.
Network Monitoring Software – Version 25.3.110.1313 (August 27, 2025)
Download for Windows and cloud-based version PRTG Hosted Monitor available
English, German, Spanish, French, Portuguese, Dutch, Russian, Japanese, and Simplified Chinese
Network devices, bandwidth, servers, applications, virtual environments, remote systems, IoT, and more
Choose the PRTG Network Monitor subscription that's best for you
Redis monitoring tracks how well your Redis is performing. PRTG watches key metrics like memory usage, latency, and connected clients. We alert you when problems pop up. This helps keep your Redis fast and reliable for your applications.
Monitoring Redis is crucial for maintaining high performance and reliability. By tracking metrics like memory usage, latency, and throughput, you can spot potential bottlenecks, optimize resource allocation, and prevent downtime. This keeps your Redis-dependent applications running smoothly and efficiently, whether Redis is used as a database, cache, message broker, or queue.
PRTG uses specialized sensors and protocols to monitor Redis instances. It can connect directly to Redis using the Redis CLI or monitor via the Redis INFO command. PRTG also uses SNMP for broader system monitoring and can track Redis performance through custom scripts and API integrations. This approach provides a comprehensive view of your Redis environment.
Yes, PRTG adapts to various Redis deployment scenarios. Whether you're running standalone Redis instances, Redis clusters, or Redis Enterprise setups, PRTG can monitor them. It supports Redis monitoring in on-premises environments, cloud platforms like AWS, Azure, and Google Cloud, and hybrid setups.
PRTG monitors a wide range of Redis metrics, including:
PRTG supports Redis performance optimization by providing real-time insights and historical data on key performance indicators. By monitoring metrics like memory usage, latency, and throughput, you can identify bottlenecks and inefficiencies. PRTG's alerting system helps catch issues early, while its detailed reporting aids in making informed decisions about scaling, configuration changes, and resource allocation.
PRTG improves Redis performance monitoring by offering a comprehensive view of your Redis database and its environment. It provides real-time insights into key performance indicators, allowing you to track the health of your data set and overall system performance. With PRTG's observability features, you can monitor everything from memory usage and latency to the number of clients and Linux-specific metrics, supporting optimal performance of your Redis instances across various deployment scenarios.
In PRTG, “sensors” are the basic monitoring elements. One sensor usually monitors one measured value in your network, for example the traffic of a switch port, the CPU load of a server, or the free space on a disk drive. On average, you need about 5-10 sensors per device or one sensor per switch port.
Paessler conducted trials in over 600 IT departments worldwide to tune its network monitoring software closer to the needs of sysadmins. The result of the survey: over 95% of the participants would recommend PRTG – or already have.

Paessler PRTG is used by companies of all sizes. Sysadmins love PRTG because it makes their job a whole lot easier.
Bandwidth, servers, virtual environments, websites, VoIP services – PRTG keeps an eye on your entire network.
Everyone has different monitoring needs. That’s why we let you try PRTG for free.