• Company
    • About Us
    • Case Studies
    • Press Center
    • Events
    • Careers
    • Blog
    • Contact us
  • Login
 
  • English
    • Deutsch
    • Español
    • Français
    • Italiano
    • Português
Paessler
                    - The Monitoring Experts
  • Products
    • Paessler PRTG
      Paessler PRTGMonitor your whole IT infrastructure
      • PRTG Network Monitor
      • PRTG Enterprise Monitor
      • PRTG Hosted Monitor
      • PRTG extensionsExtensions for Paessler PRTGExtend your monitoring to a new level
    • Icon Features
      FeaturesExplore all monitoring features
      • Maps & dashboards
      • Alerts & notifications
      • Multiple user interfaces
      • Distributed monitoring
      • Customizable reporting
  • Solutions
    • Industries
      IndustriesMonitor various industry sectors
      • Industrial
      • Healthcare
      • Data Center
      • Education
      • Finance
      • Government
    • IT Topics
      IT TopicsMonitor all areas of IT
      • Network Monitoring
      • Bandwidth Monitoring
      • SNMP Monitor
      • Network Mapping
      • WiFi Monitoring
      • Server Monitoring
  • Pricing
  • Resources
    • Getting Started
      Getting StartedModules for self-paced learning
    • How-to Guides
      How-to GuidesGet the most out of PRTG
    • Videos & Webinars
      Videos & WebinarsLearn from Paessler experts
    • IT  Knowledge
      IT KnowledgeExpand your IT knowledge
    • PRTG Manual
      PRTG ManualFull documentation
    • Knowledge Base
      Knowledge BaseShare community knowledge
    • PRTG Sensor Hub
      PRTG Sensor HubGet sensors, scripts & templates
    • Trainings
      PRTG TrainingLearn how to work with PRTG
  • Partners
    • icon star
      New Partners and MSPBecome a new partner or MSP
    • icon partner
      Partner PortalLog in to your partner account
    • icon search
      Find a PartnerFind partners selling Paessler products
    • icon technology
      Technology AlliancesSee Paessler technology partnerships
  • Company
    • About Us
    • Case Studies
    • Press Center
    • Events
    • Careers
    • Blog
    • Contact us
  • Login
  • English
    • Deutsch
    • Español
    • Français
    • Italiano
    • Português
  • Get a quote
  • Free trial
  1. Home>
  2. IT Topics>
  3. Performance>
  4. Bandwidth Manager
PRTG Logo

Bandwidth Manager PRTG

Monitor, control, and manage your bandwidth round the clock

  • Measure, check, limit, and customize your bandwidth allocation
  • Get detailed information about network traffic for better decision-making
  • Monitor and adjust the individual bandwidth consumption per device
Free download
product overview

Our users give top ratings for monitoring with Paessler PRTG

Gartner peer insights
spiceworks
Capterra
G2
Trustpilot

PRTG bandwidth manager: What you will find on this page

Table of content
  • Cure your network congestion nightmares
  • What bandwidth management looks like in PRTG
  • 3 reasons to choose PRTG as your bandwidth management tool
  • Explore our preconfigured PRTG sensors for bandwidth management
  • Manage bandwidth: FAQ

PRTG makes LAN bandwidth management as easy as it gets

Custom alerts and data visualization let you quickly identify and prevent network congestion issues. 

Free download
PRODUCT OVERVIEW

Cure your network congestion nightmares

Sure, you can worry about whether your data flows efficiently from point to point, if important information is getting through security, or what might happen if network issues become user issues. Or, you can kick back on the beach and enjoy knowing Paessler PRTG is your bandwidth management software.

Identify bandwidth hogs

Bandwidth hogs are those greedy devices on your network that use more bandwidth than they should, slowing down other users. PRTG helps you locate these hogs and manage or limit their bandwidth usage.

This reduces congestion, allowing for faster network speed and fair use for other devices and people on the network.

Bandwidth over the long run

Long-term monitoring often provides for new and interesting findings. PRTG provides a wealth of historical data that gives exponential decision-making power, answering important questions that allow you to appropriately upgrade or expand your network.

Identify peak hours and learn which devices use the most bandwidth to design a more effective network.

Track different traffic types

Analyze the different types of network traffic so you can manage your bandwidth usage more effectively. VoIP, web browsing, file transfers, and more use network resources at different levels.

Filter data traffic according to IP addresses, protocols, data types, ports, and more, and make sure your traffic is flowing correctly with PRTG.

Limit bandwidth as needed

Some tasks and devices don’t need as much bandwidth as others, so PRTG lets you identify where you can limit bandwidth based on needs. For example, you can limit bandwidth for backups so they don’t take as much.

You can also allocate bandwidth on a router-to-router basis or in switches, or restrict LAN bandwidth by specifying which traffic has priority on the devices connected to your LAN.

Customize your alert levels

Only receive alerts about bandwidth limits when they’re absolutely necessary, customized by you to meet your particular needs. You know your network best, so PRTG lets you customize your alerts based on the warning and error thresholds you set.

You can also set the seriousness of the alert and the people to be notified when an alert is triggered.

What bandwidth management looks like in PRTG

Diagnose network issues by continuously tracking your endpoints’ bandwidth consumption. Show bandwidth bottlenecks, quality of service (QoS) parameters, internet usage, traffic patterns, and other key metrics in real time. Visualize monitoring data in clear graphs and dashboards to identify problems more easily. Gain the visibility you need to troubleshoot latency, network congestion, and other network performance issues.

PRTG Screenshot device tree view

Device tree view of the complete monitoring setup

PRTG screenshot map entire it infrastructure

Custom PRTG dashboard for keeping an eye on the entire IT infrastructure

PRTG screenshot graph live data traffic

Live traffic data graph in PRTG


Start managing and troubleshooting your bandwidth with PRTG and see how it can make your network more reliable and your job easier.

Free download
PRODUCT OVERVIEW

IT experts agree: Paessler PRTG is a great solution for IT infrastructure monitoring

PCMag

“All-around winning
 network monitor”

IT Brief

“The real beauty of PRTG is the endless possibilities it offers”

ITPro

“PRTG Network Monitor 
is very hard to beat”

3 reasons to choose PRTG as your bandwidth management tool

icon click

All-in-one monitoring

Let’s face it: nobody really wants to have five pieces of software to monitor one network. With PRTG, you don’t have to. Our monitoring software can do way more than bandwidth monitoring and management, and also includes an alarm system, reporting, and custom visualization options. If you opt for a license, you’ll get access to its full range of network monitoring features.

icon backup

Detailed information

Learn what you need to know about your network for optimal performance, less congestion, better data flow, and more efficient usage. PRTG comes with more than 250 preconfigured sensor types out of the box to help you monitor your entire network, including preconfigured SNMP Traffic, Packet Sniffer, and flow (NetFlow, sFlow, jFlow, IPFIX) sensors.

icon monitor

Everything at a glance

Outdated equipment or faulty configurations can also lead to malfunctions. PRTG lets you keep a constant eye on your entire IT environment in one central dashboard. Get an immediate overview or dig down for a more detailed view. Easily set up and configure PRTG and see the network information you need when you need it.

Explore our preconfigured PRTG sensors for bandwidth management

PRTG comes with more than 250 native sensor types for monitoring your entire on-premises, cloud, and hybrid cloud environment out of the box. Check out some examples below!

SNMP Traffic v2

The SNMP Traffic v2 sensor monitors bandwidth and traffic on a device. It can show the following:

  • Number of incoming and outgoing broadcast, multicast, unicast, and non-unicast packets
  • Number of incoming and outgoing discards and errors
  • Total, incoming, and outgoing traffic
  • Number of incoming, unknown protocols
SNMP Traffic v2
SNMP Traffic v2

Packet Sniffer

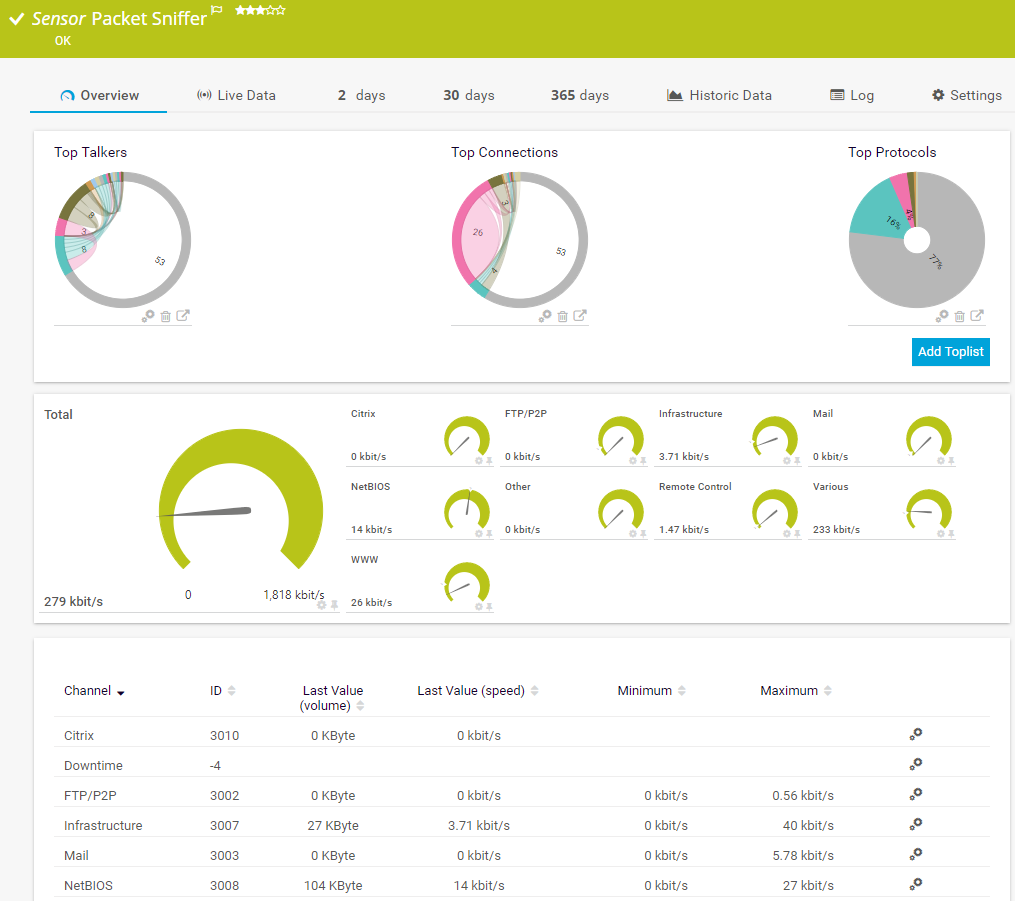
The Packet Sniffer sensor monitors the headers of data packets that pass a local network card using a built-in packet sniffer. You can choose from predefined channels. It can show the following and more:

  • Traffic from Citrix applications
  • Traffic from file transfer (FTP/P2P) and various other protocols (UDP, TCP)
  • Traffic from network services (DHCP, DNS, Ident, ICMP, SNMP)
  • Internet mail traffic (IMAP, POP3, SMTP)
  • Traffic from remote control applications (RDP, SSH, Telnet, Virtual Network Computing (VNC))
Packet Sniffer
Packet Sniffer

sFlow

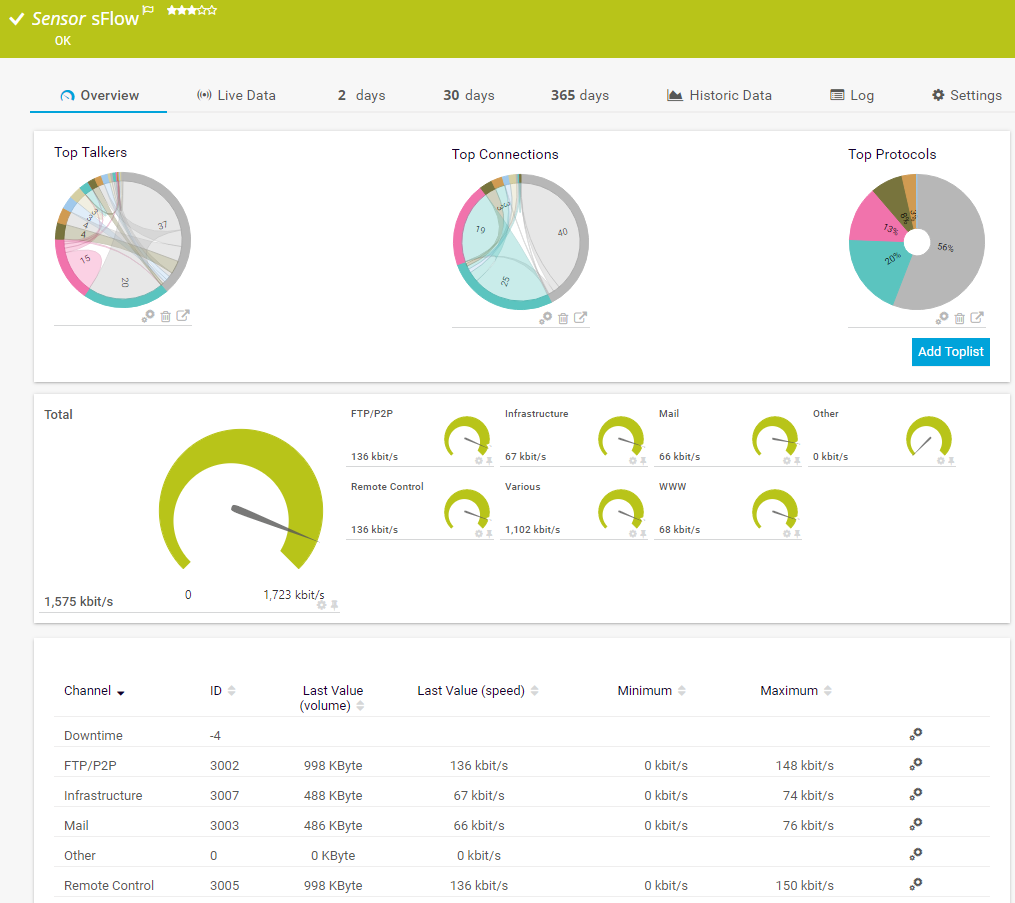
The sFlow sensor receives traffic data from an sFlow v5-compatible device and shows the traffic by type. This sensor has several filter options to divide traffic into different channels. It can show the following and more:

  • Traffic from Citrix applications
  • Traffic from file transfer (FTP/P2P) and various other protocols (UDP, TCP)
  • Traffic from network services (DHCP, DNS, Ident, ICMP, SNMP)
  • Internet mail traffic (IMAP, POP3, SMTP)
  • Traffic from remote control applications (RDP, SSH, Telnet, Virtual Network Computing (VNC))
sFlow
sFlow

Windows Network Card

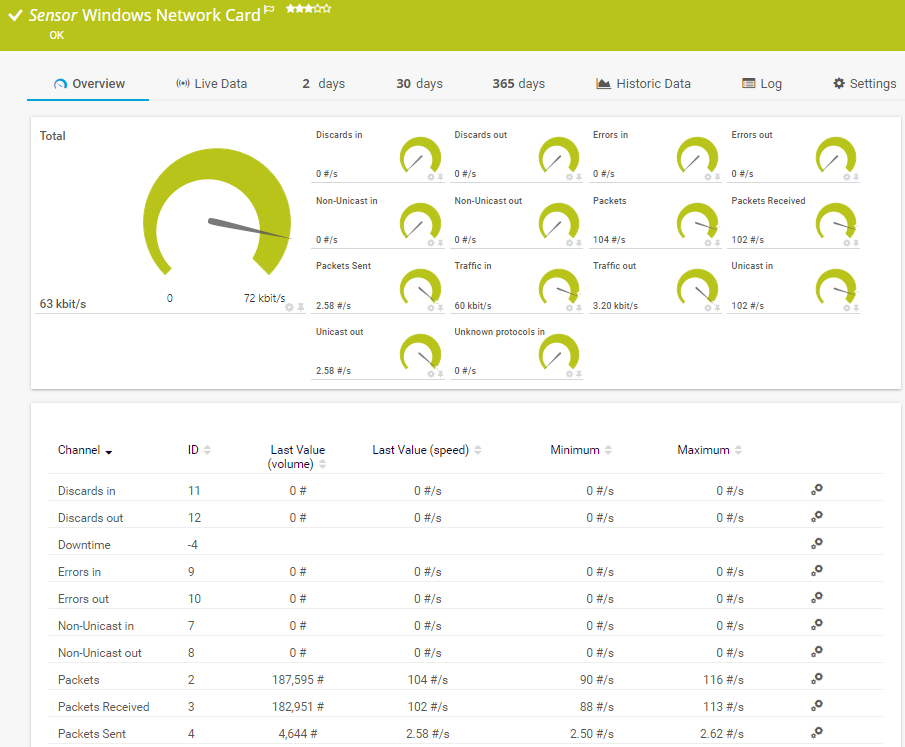
The Windows Network Card sensor monitors the bandwidth usage and traffic of a network interface via Windows Management Instrumentation (WMI) or Windows performance counters. It can show the following:

  • Number of incoming and outgoing discards, errors, and unicast and non-unicast packets
  • Total, incoming, and outgoing traffic
  • Number of packets total, sent, and received
  • Number of unknown protocols
Windows Network Card

See the PRTG Manual for a list of all available sensor types.

PRTG is compatible with all major vendors, products, and systems

compatible with all major vendors, products, and systems

PRTG makes LAN bandwidth management as easy as it gets

Custom alerts and data visualization let you quickly identify and prevent network congestion issues. 

Free download
PRODUCT OVERVIEW

“PRTG helps us to keep control of our IT by making issues visible immediately – and everywhere. We always have an eye on the performance and availability of our IT and can react in time if any failures occur. On a long-term perspective, the monitoring data helps us with capacity planning so that we can deliver the required resources for our own systems as well as for our customers, without wasting money on unwarranted redundancies.”

Stein Erik Høybakk, Senior Network Engineer
TAFJORD

“All our production and business processes depend on SAP. But, of course, IT and production systems also play a crucial role in securing these processes. By incorporating SAP, production, and IT into one centralized monitoring system, we can quickly detect critical drops in performance and identify the causes of these issues. In fact, thanks to PRTG and itesys, this couldn’t be any easier.”

Andreas Schmidt, Senior Systems Engineer
Truma

“Any downtime could be detrimental to our customers. We also strive to provide the best possible service to our customers. PRTG allows us to see the health and performance of the network. Using these measurements we can make decisions on how to repair a piece of equipment before it fails and causes a service interruption.”

James Ott Jr., Communications System Technician and IT Administrator
Federal Radio

Your bandwidth manager at a glance – even on the go


Set up PRTG in minutes and use it on almost any mobile device.

device overview
Gartner peer insights

“Excellent tool for detailed monitoring. Alarms and notifications work greatly. Equipment addition is straight forward and server initial setup is very easy. ...feel safe to purchase it if you intend to monitor a large networking landscape.”

Read the complete review at Gartner Peer Insights

Create innovative solutions with Paessler’s IT partners

Partnering with innovative IT vendors, Paessler unleashes synergies to create
new and additional benefits for joined customers.

IP Fabric

IP Fabric

Combining PRTG’s broad monitoring feature set with IP Fabric’s automated network assurance creates a new level of network visibility and reliability.

Read more
Rhebo

Rhebo

Rhebo and PRTG offer a comprehensive monitoring solution for IT and OT environments: from condition monitoring through to anomaly and threat detection.

Read more
UVnetworks

UVnetworks

UVexplorer integrates tightly with PRTG to bring fast and accurate network discovery, detailed device inventory, and automatic network mapping to the PRTG platform.

Read more

Find the root cause of the problem with our PRTG network bandwidth management solution

Real-time notifications mean faster troubleshooting so that you can act before more serious issues occur.

Free download
PRODUCT OVERVIEW
Paessler PRTG

Paessler PRTG

Network Monitoring Software – Version 24.4.102.1351 (November 12th, 2024)

Hosting icon

Hosting

Download for Windows and cloud-based version PRTG Hosted Monitor available

Languages icon

Languages

English, German, Spanish, French, Portuguese, Dutch, Russian, Japanese, and Simplified Chinese

test

Monitor everything

Network devices, bandwidth, servers, applications, virtual environments, remote systems, IoT, and more

test

Pricing

Choose the PRTG Network Monitor subscription that's best for you

Discover more monitoring insights and stories

Resources Solution

Solutions for all your monitoring needs

  • Bandwidth control: Improve your network performance
  • Network Management
  • Test the bandwidth of large networks
Resources Content

Powerful stories from the monitoring world

  • Easy ways to quickly test your bandwidth
  • Customer success story Tri-County Technical College & PRTG
  • Customer success story University of Mosul & PRTG
Resources Solutions

Resources to master your monitoring challenges

  • Bandwidth monitoring SNMP vs Netflow?
  • How do I differentiate between excessive bandwidth usage with PRTG?
  • How do I customize detection for "Unusual" sensor status in PRTG?

Manage bandwidth: FAQ


What is bandwidth management?

Bandwidth management is an important part of network administration. It makes sure that important applications, devices, and connections (such as internet connections or wireless internet access) have the bandwidth they need to operate. It allows informed allocation of network resources, helps you manage your network traffic better, checks if your Internet Service Provider (ISP) meets your bandwidth requirements, and keeps your network more secure.

Can I improve my network speed with bandwidth management?

Yes. Bandwidth management provides a range of management capabilities that positively affect speed. For example, by managing bandwidth allocation, you can reduce network congestion, which has the benefit of improving your network speed.

What’s the difference between bandwidth monitoring, bandwidth management, and bandwidth controlling?

With bandwidth monitoring, you won’t yet be actively managing your bandwidth. Instead, you'll simply observe the amount of bandwidth that is consumed by your network’s devices and applications and then make a decision on how best to manage your bandwidth.

Active bandwidth management includes the distribution of bandwidth to the devices in your network. A variety of bandwidth management tools are available to help you manage bandwidth. You can also adjust the individual bandwidth consumption of devices in the respective device’s settings.

Bandwidth controlling is usually used synonymously with bandwidth management. You can use it to measure, check, limit, and customize the distribution of your bandwidth and data rates at any time.

With PRTG, you can control your data rate and test bandwidth. You cannot, however, prioritize traffic. If you wish to prioritize traffic, think about picking up a separate bandwidth controller tool.

Can PRTG monitor real-time bandwidth usage?

Yes. PRTG is an all-in-one monitoring solution. Through various sensors, PRTG can track the data passing through your network in real time.

Does PRTG reduce network costs?

Absolutely! Studies have shown that PRTG can help lower network costs in several ways. Being able to optimize your network helps reduce the cost of bandwidth upgrades. Another way is through resource allocation. Appropriately allocating network resources makes your network perform better, saving costs on network failures or service interruptions.

What is a sensor in PRTG?

In PRTG, “sensors” are the basic monitoring elements. One sensor usually monitors one measured value in your network, for example the traffic of a switch port, the CPU load of a server, or the free space on a disk drive. On average, you need about 5-10 sensors per device or one sensor per switch port.

We asked: would you recommend PRTG? Over 95% of our customers say yes!

Paessler conducted trials in over 600 IT departments worldwide to tune its network monitoring software closer to the needs of sysadmins. The result of the survey: over 95% of the participants would recommend PRTG – or already have.

recommendation

Still not convinced?

Love

More than 500,000 sysadmins love PRTG

Paessler PRTG is used by companies of all sizes. Sysadmins love PRTG because it makes their job a whole lot easier.

PRTG

Monitor your entire IT infrastructure

Bandwidth, servers, virtual environments, websites, VoIP services – PRTG keeps an eye on your entire network.

test

Try Paessler PRTG for free

Everyone has different monitoring needs. That’s why we let you try PRTG for free.

PRTG Logo

Start managing your bandwidth with PRTG and see how it can make your network more reliable and your job easier.

Free download
PRODUCT OVERVIEW

Products

  • Paessler PRTG
    Paessler PRTGMonitor your whole IT infrastructure
    • PRTG Network Monitor
    • PRTG Enterprise Monitor
    • PRTG Hosted Monitor
    • PRTG extensions
      Extensions for Paessler PRTGExtend your monitoring to a new level
  • Icon Features
    FeaturesExplore all monitoring features

Monitoring with PRTG

  • Network monitoring
  • Bandwidth monitoring
  • SNMP monitoring
  • Network mapping
  • Wi-Fi monitoring
  • Server monitoring
  • Network traffic analyzer
  • NetFlow monitoring
  • Syslog server

Useful Links

  • PRTG Manual
  • Knowledge Base
  • Customer Success Stories
  • About Paessler
  • Subscribe to newsletter
  • PRTG Support
  • PRTG Consulting

Contact

Paessler GmbH
Thurn-und-Taxis-Str. 14, 
90411 Nuremberg 
Germany

info@paessler.com

+49 911 93775-0

  • Contact us
©2025 Paessler GmbHTerms & ConditionsPrivacy PolicyImprintReport VulnerabilityDownload & InstallSitemap
404 - Page not found 404 - Page not found 404 - Page not found