• Company
    • About Us
    • Case Studies
    • Press Center
    • Events
    • Careers
    • Blog
    • Contact us
  • Login
 
  • English
    • Deutsch
    • Español
    • Français
    • Italiano
    • Português
Paessler
                    - The Monitoring Experts
  • Products
    • Paessler PRTG
      Paessler PRTGMonitor your whole IT infrastructure
      • PRTG Network Monitor
      • PRTG Enterprise Monitor
      • PRTG Hosted Monitor
      • PRTG extensionsExtensions for Paessler PRTGExtend your monitoring to a new level
    • Icon Features
      FeaturesExplore all monitoring features
      • Maps & dashboards
      • Alerts & notifications
      • Multiple user interfaces
      • Distributed monitoring
      • Customizable reporting
  • Solutions
    • Industries
      IndustriesMonitor various industry sectors
      • Industrial
      • Healthcare
      • Data Center
      • Education
      • Finance
      • Government
    • IT Topics
      IT TopicsMonitor all areas of IT
      • Network Monitoring
      • Bandwidth Monitoring
      • SNMP Monitor
      • Network Mapping
      • WiFi Monitoring
      • Server Monitoring
  • Pricing
  • Resources
    • Getting Started
      Getting StartedModules for self-paced learning
    • How-to Guides
      How-to GuidesGet the most out of PRTG
    • Videos & Webinars
      Videos & WebinarsLearn from Paessler experts
    • IT  Knowledge
      IT KnowledgeExpand your IT knowledge
    • PRTG Manual
      PRTG ManualFull documentation
    • Knowledge Base
      Knowledge BaseShare community knowledge
    • PRTG Sensor Hub
      PRTG Sensor HubGet sensors, scripts & templates
    • Trainings
      PRTG TrainingLearn how to work with PRTG
  • Partners
    • icon star
      New Partners and MSPBecome a new partner or MSP
    • icon partner
      Partner PortalLog in to your partner account
    • icon search
      Find a PartnerFind partners selling Paessler products
    • icon technology
      Technology AlliancesSee Paessler technology partnerships
  • Company
    • About Us
    • Case Studies
    • Press Center
    • Events
    • Careers
    • Blog
    • Contact us
  • Login
  • English
    • Deutsch
    • Español
    • Français
    • Italiano
    • Português
  • Get a quote
  • Free trial
  1. Home>
  2. IT Topics>
  3. Network>
  4. SAN Monitoring
PRTG Logo

SAN Monitoring with PRTG

Monitor storage resources and build a superior area storage network strategy

  • Ensure your SAN operates at peak efficiency without unexpected slowdowns
  • Receive immediate notifications on critical SAN health and performance metrics
  • Leverage intuitive dashboards for a comprehensive view of your SAN's health
Free download
product overview

Our users give top ratings for monitoring with Paessler PRTG

Gartner peer insights
spiceworks
Capterra
G2
Trustpilot

PRTG SAN monitoring: What you will find on this page

Table of content
  • Maximize the performance and reliability of your storage infrastructure
  • What SAN monitoring looks like in PRTG
  • 5 reasons to choose PRTG as your SAN monitoring tool
  • Explore our preconfigured PRTG sensors for SAN Monitoring
  • How SAN monitoring with PRTG works
  • SAN Monitoring: FAQ

PRTG makes Storage Area Network monitoring as easy as it gets

Custom alerts and data visualization let you quickly identify and prevent SAN performance issues.

Free download
PRODUCT OVERVIEW

Maximize the performance and reliability of your storage infrastructure

Ensuring the optimal performance and reliability of your storage area network (SAN) is crucial for the smooth operation of your business's critical applications and services. Paessler PRTG offers a 360-degree view of your SAN infrastructure, ensuring high availability and performance while minimizing risks associated with data loss and downtime.

Icon bottleneck

Proactively identify and address performance bottlenecks

Keep your storage system running at peak efficiency with PRTG's detailed performance tracking. Monitor throughput, IOPS, and network latency across all SAN components.

Quickly identify and troubleshoot bottlenecks or abnormal performance degradation. This proactive approach helps maintain a seamless data flow and optimizes your network's overall performance.

Icon alarm

Ensure continuous SAN health with real-time alerts

Stay ahead of potential issues with customizable, real-time alerts on the health and status of your SAN infrastructure.

Whether it's hardware failures, capacity thresholds, or unexpected changes in performance, PRTG sends immediate notifications to designated stakeholders, allowing for swift action to prevent downtime and ensure continuous data availability.

Icon Capacity

Optimize capacity planning with detailed usage insights

Effective storage management is key to a scalable and efficient network. With PRTG SAN monitoring tools, gain in-depth insights into storage utilization and growth trends across disks, arrays, and pools.

These insights enable precise storage capacity planning, helping you make informed decisions about expansions, upgrades, and optimizations to support your organization's data storage needs.

Icon dashboard

Streamline SAN monitoring with an intuitive dashboard

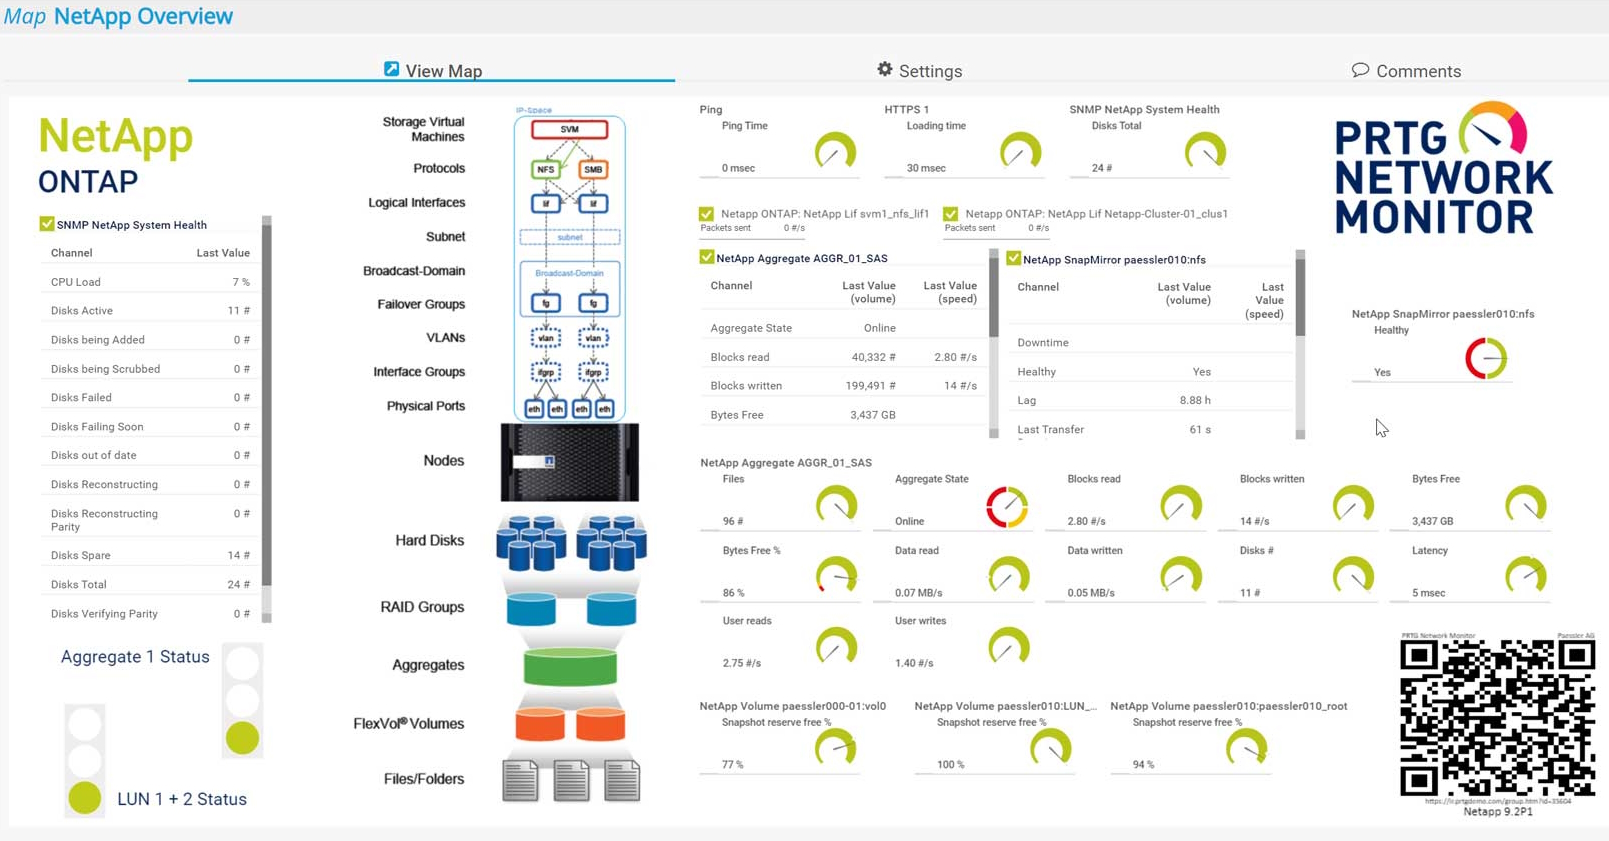
Simplify your SAN monitoring with PRTG's intuitive and customizable dashboards. Gain a centralized view of your storage network's performance, capacity, and health metrics at a glance.

This centralized oversight allows for easy monitoring and management, saving time and reducing complexity in overseeing your SAN environment.

What SAN monitoring looks like in PRTG

Diagnose network issues by continuously tracking your storage area network, including SAN switches and routers, server performance, and more, all from a single pane of glass. Show uptime, bandwidth usage, IOPs, and other key metrics in real time. Visualize monitoring data in clear graphs and dashboards to identify problems more easily. Gain the overview you need to troubleshoot all kinds of SAN infrastructure performance issues.

PRTG Screenshot device tree view

Device tree view of the complete monitoring setup

PRTG screenshot map entire it infrastructure

Custom PRTG dashboard for keeping an eye on the entire IT infrastructure

PRTG screenshot graph live data traffic

Live traffic data graph in PRTG

Storage Monitoring

Storage Monitoring

Start SAN monitoring with PRTG and see how it can make your network more reliable and your job easier.

Free download
PRODUCT OVERVIEW

IT experts agree: Paessler PRTG is a great solution for IT infrastructure monitoring

PCMag

“All-around winning
 network monitor”

IT Brief

“The real beauty of PRTG is the endless possibilities it offers”

ITPro

“PRTG Network Monitor 
is very hard to beat”

5 reasons why PRTG is the SAN monitoring tool of your choice

Comprehensive storage network monitoring

PRTG offers extensive network monitoring capabilities across your SAN. From individual disks to entire storage arrays, PRTG helps you ensure every component is under surveillance for optimal performance and reliability.

Real-time performance insights

Monitor key performance metrics in real-time to immediately identify and resolve issues that could impact your SAN's efficiency and the availability of critical services, and to ensure your co-workers are able to access SAN data without delays.

Customizable alerting & notification system

Tailor alerts to meet the specific needs of your SAN environment and only get the notifications you want. Set device-level thresholds from critical for highly sensitive devices to warning for non-critical or low-sensitivity network devices.

Effortless setup and scalability

PRTG's user-friendly setup process and flexible integration options make it easy to start monitoring your SAN infrastructure right away, with minimal disruption to your existing workflows. And, as your data storage needs grow, PRTG scales with you.

High network and data security

The use of RAID technology makes storage area networks especially secure. Make it even more secure by continuously monitoring your SANs with PRTG, and comprehensively protect your stored data against hardware errors or data loss.

Explore our preconfigured PRTG sensors for SAN monitoring

PRTG comes with more than 250 native sensor types for monitoring your entire on-premises, cloud, and hybrid cloud environment out of the box. Check out some examples below!

SSH SAN System Health

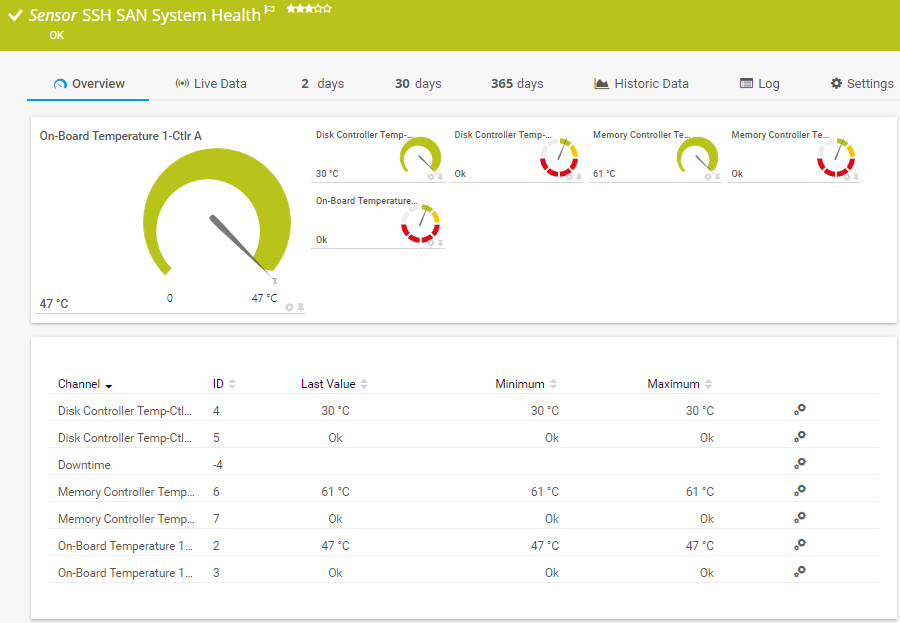
The SSH SAN System Health sensor monitors the system health of a storage area network (SAN) via Secure Shell (SSH). It can show the following:

  • Overall unit status
  • Capacitor cell and pack voltage and voltage status
  • Disk and memory controller temperature and temperature status
  • On-board temperature and temperature status
SSH SAN System Health

SSH SAN Physical Disk

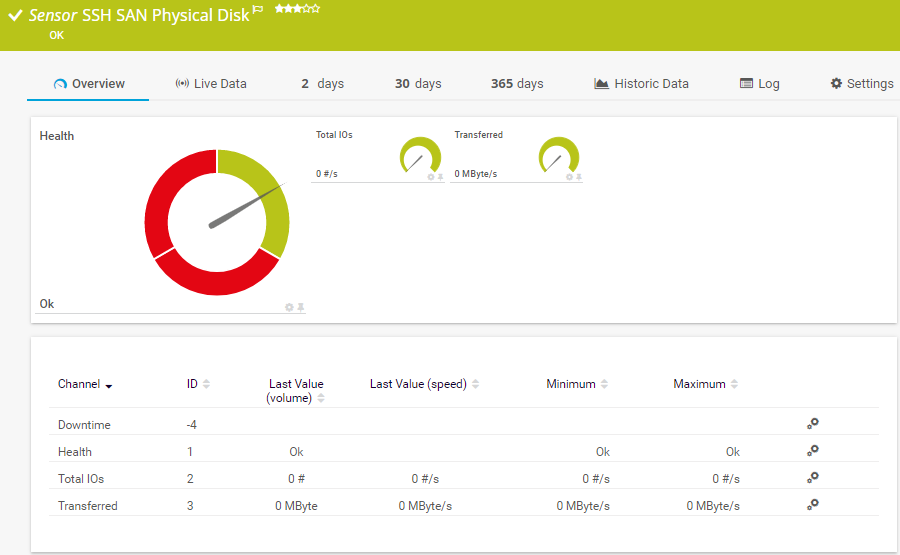
The SSH SAN Physical Disk sensor monitors a physical disk on a storage area network (SAN) via Secure Shell (SSH). It can show the following:

  • Disk health status
  • Total number of I/O operations
  • Data transferred
SSH SAN Physical Disk

SSH SAN Logical Disk

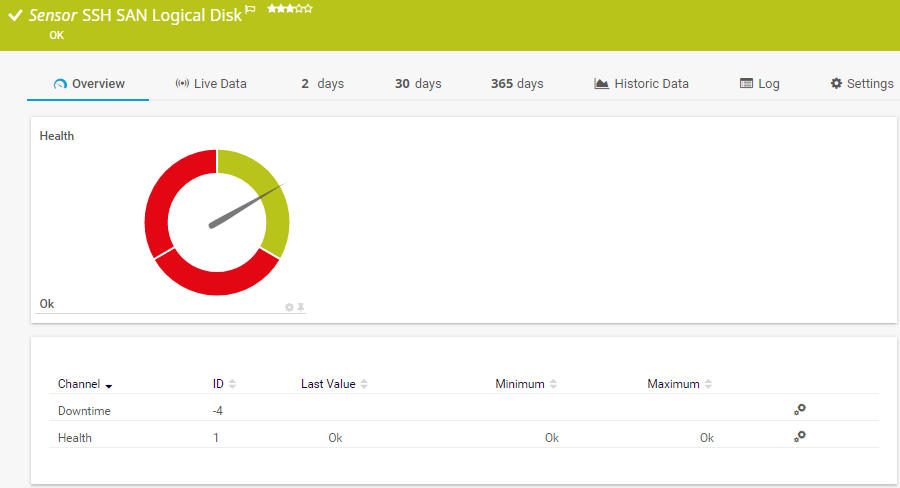
The SSH SAN Logical Disk sensor monitors a logical disk on a storage area network (SAN) via Secure Shell (SSH). It can show the following:

  • Disk health status
  • Downtime
SSH SAN Logical Disk

SSH SAN Enclosure

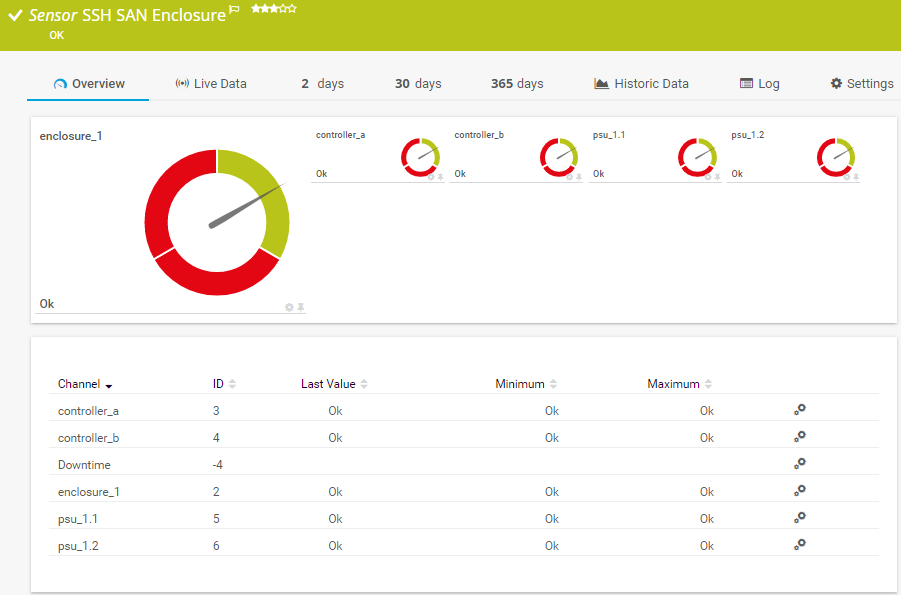
The SSH SAN Enclosure sensor monitors a storage area network (SAN) enclosure via Secure Shell (SSH). It can show the following:

  • Controller status
  • Overall enclosure status
  • Power supplies status
SSH SAN Enclosure
SSH SAN Enclosure

See the PRTG Manual for a list of all available sensor types.

PRTG is compatible with all major vendors, products, and systems

compatible with all major vendors, products, and systems

How SAN monitoring with PRTG works

PRTG comes with preconfigured sensor templates for storage monitoring that you can use with the products of a wide variety of manufacturers, including Dell PowerVault, Dell EqualLogic, IBM, HPE, and NetApp. Our manufacturer-independent SAN sensors use SSH to query data. A command line interface must be present in the SAN to be able to monitor your storage area networks with SSH.

SSH SAN System Health

The SSH SAN System Health sensor can monitor the following:

  • Overall status
  • Disk controller, memory controller, and on-board temperature
  • Capacitor cell and pack voltage

SSH SAN Physical Disk

The SSH SAN Physical Disk sensor can monitor the following:

  • Hard disk health status
  • Number of I/O operations per second
  • Amount of data transmitted per second

SSH SAN Logical Disk

The SSH SAN Logical Disk sensor can monitor the following:

  • Logical disk health status per LUN
  • Number of I/O operations per second
  • Amount of data transmitted per second

SSH SAN Enclosure

The SSH SAN Enclosure sensor can monitor the following:

  • Overall enclosure status
  • Power supply status
  • Controller status

PRTG makes SAN monitoring as easy as it gets

Custom alerts and data visualization let you quickly identify and prevent SAN performance issues.

Free download
PRODUCT OVERVIEW

”Adopting PRTG has been like going from being in the dark to being in the light. Before, we had limited visibility into what was happening in the infrastructure and in the network. Now, however, thanks to the comprehensive dashboard and real-time notifications, we receive constant updates on the status of facilities and services, and our way of working has gone from passive to proactive.”

Luca Meneghesso, Senior IT infrastructure and Security Specialist
Banca Profilo

”GESAC increasingly focuses on innovation to improve the quality of services offered and the experience of passengers handled every day by Naples Airport. Thanks to PRTG, we finally have unified, automatic, and continuous monitoring of the airport network and can guarantee quick and timely interventions.”

Domenico Ciervo, GESAC ICT Manager
Naples International Airport

”As an international company, PRTG is ideal for us. If something went down half way across the world, we wouldn’t be woken up – we can rely on PRTG to identify the problem and alert us before it occurs – enabling the right person, in the right time zone to resolve the problem. At the end of the day, if we’re to provide an internal network experience for our employees that meets expectations, we need a tool like PRTG to be successful.”

Barry Kelly, Systems Engineer
Skyscanner

“I would recommend PRTG because it has helped us significantly improve service uptime by highlighting important alerts that would otherwise result in a system failure or service disruption if action was not taken. Thanks to PRTG, we can ensure that The Ritz London’s network and IT systems are five-star, just like the hotel.”

Richard Isted, IT Manager
The Ritz London

Your SAN monitor at a glance – even on the go

PRTG is set up in a matter of minutes and can be used on a wide variety of mobile devices.

device overview
Gartner peer insights

“Excellent tool for detailed monitoring. Alarms and notifications work greatly. Equipment addition is straight forward and server initial setup is very easy. ...feel safe to purchase it if you intend to monitor a large networking landscape.”

Read the complete review at Gartner Peer Insights

Create innovative solutions with Paessler’s IT partners

Partnering with innovative IT vendors, Paessler unleashes synergies to create
new and additional benefits for joined customers.

ScriptRunner

ScriptRunner

With ScriptRunner Paessler integrates a powerful event automation platform into PRTG Network Monitor.

Read more
Martello

Martello 

By integrating PRTG with Martello iQ, you can add a fast analytics layer to improve uptime, visualize your IT environment, and integrate all of your IT systems into a single pane of glass.

Read more
Siemon

Siemon

Siemon and Paessler bring together intelligent building technology and advanced monitoring and make your vision of intelligent buildings and data centers become reality.

Read more

Find the root cause of the problem with our PRTG storage area network monitoring software

Real-time notifications mean faster troubleshooting so that you can act before more serious issues occur.

Free download
PRODUCT OVERVIEW
Paessler PRTG

Paessler PRTG

Network Monitoring Software – Version 24.4.102.1351 (November 12th, 2024)

Hosting icon

Hosting

Download for Windows and cloud-based version PRTG Hosted Monitor available

Languages icon

Languages

English, German, Spanish, French, Portuguese, Dutch, Russian, Japanese, and Simplified Chinese

test

Monitor everything

Network devices, bandwidth, servers, applications, virtual environments, remote systems, IoT, and more

test

Pricing

Choose the PRTG Network Monitor subscription that's best for you

Discover more monitoring insights and stories

Resources Solution

Solutions for all your monitoring needs

  • SSH Monitoring
  • The monitoring solution for all areas of IT!
  • Dell Monitoring
Resources Content

Powerful stories from the monitoring world

  • PRTG For Fortnite Fanatics and Bitcoin Barons
  • Customer success story Virginia Tech CALS & PRTG
  • INSYS icom + Node-RED + PRTG = Monitoring OT data
Resources Solutions

Resources to master your monitoring challenges

  • Monitoring a HP P2040 SAN?
  • SSH SAN System Health Sensor
  • Dell Compellent SAN monitoring

SAN Monitoring: FAQ


What is a SAN?

SAN stands for storage area network. It's a specialized, high-speed network that connects servers to storage devices such as disk arrays, tape libraries, and other storage devices. SANs are typically used to enhance storage devices' accessibility, scalability, and performance. They provide block-level access to storage, allowing multiple servers to access the same storage resources concurrently, which can be crucial in enterprise environments with large-scale storage needs and high availability requirements.

Can PRTG monitor both Fibre Channel and iSCSI SANs?

Yes, PRTG provides comprehensive monitoring capabilities for both Fibre Channel and iSCSI SANs, offering deep insights into the performance and health of your storage networks regardless of the underlying technology.

How does PRTG help in preventing SAN-related downtime?

By offering real-time threshold monitoring and alerts for performance bottlenecks, capacity issues, hardware failures, and more, PRTG enables IT teams to address problems promptly, significantly reducing the risk of SAN-related downtime.

Does PRTG support the monitoring of multi-vendor SAN environments?

Absolutely. PRTG is designed to support SAN monitoring across a variety of vendors, ensuring seamless and unified monitoring capabilities even in heterogeneous storage environments.

Can PRTG predict future SAN capacity requirements?

Absolutely. PRTG is designed to support SAN monitoring across a variety of vendors, ensuring seamless and unified monitoring capabilities even in heterogeneous storage environments.

What is a sensor in PRTG?

In PRTG, “sensors” are the basic monitoring elements. One sensor usually monitors one measured value in your network, for example the traffic of a switch port, the CPU load of a server, or the free space on a disk drive. On average, you need about 5-10 sensors per device or one sensor per switch port.

We asked: would you recommend PRTG? Over 95% of our customers say yes!

Paessler conducted trials in over 600 IT departments worldwide to tune its network monitoring software closer to the needs of sysadmins. The result of the survey: over 95% of the participants would recommend PRTG – or already have.

recommendation

Still not convinced?

Love

More than 500,000 sysadmins love PRTG

Paessler PRTG is used by companies of all sizes. Sysadmins love PRTG because it makes their job a whole lot easier.

PRTG

Monitor your entire IT infrastructure

Bandwidth, servers, virtual environments, websites, VoIP services – PRTG keeps an eye on your entire network.

test

Try Paessler PRTG for free

Everyone has different monitoring needs. That’s why we let you try PRTG for free.

PRTG Logo

Start SAN monitoring with PRTG and see how it can make your network more reliable and your job easier.

Free download
PRODUCT OVERVIEW

Products

  • Paessler PRTG
    Paessler PRTGMonitor your whole IT infrastructure
    • PRTG Network Monitor
    • PRTG Enterprise Monitor
    • PRTG Hosted Monitor
    • PRTG extensions
      Extensions for Paessler PRTGExtend your monitoring to a new level
  • Icon Features
    FeaturesExplore all monitoring features

Monitoring with PRTG

  • Network monitoring
  • Bandwidth monitoring
  • SNMP monitoring
  • Network mapping
  • Wi-Fi monitoring
  • Server monitoring
  • Network traffic analyzer
  • NetFlow monitoring
  • Syslog server

Useful Links

  • PRTG Manual
  • Knowledge Base
  • Customer Success Stories
  • About Paessler
  • Subscribe to newsletter
  • PRTG Support
  • PRTG Consulting

Contact

Paessler GmbH
Thurn-und-Taxis-Str. 14, 
90411 Nuremberg 
Germany

info@paessler.com

+49 911 93775-0

  • Contact us
©2025 Paessler GmbHTerms & ConditionsPrivacy PolicyImprintReport VulnerabilityDownload & InstallSitemap
404 - Page not found 404 - Page not found 404 - Page not found