


In PRTG, sensors are the basic monitoring elements. One sensor usually monitors one measured value in your infrastructure, for example, the traffic of a switch port, the CPU load of a server, or the free space of a disk drive.
PRTG offers over 250 pre-configured sensor types, covering a wide range of technologies and protocols. Some popular sensor types include:
In addition to pre-configured sensors, PRTG allows you to create custom sensors using various methods:
This flexibility ensures that you can monitor even the most unique aspects of your IT environment.
Each sensor can be fine-tuned with various settings:
These settings allow you to optimize monitoring performance and align alerts with your specific needs.
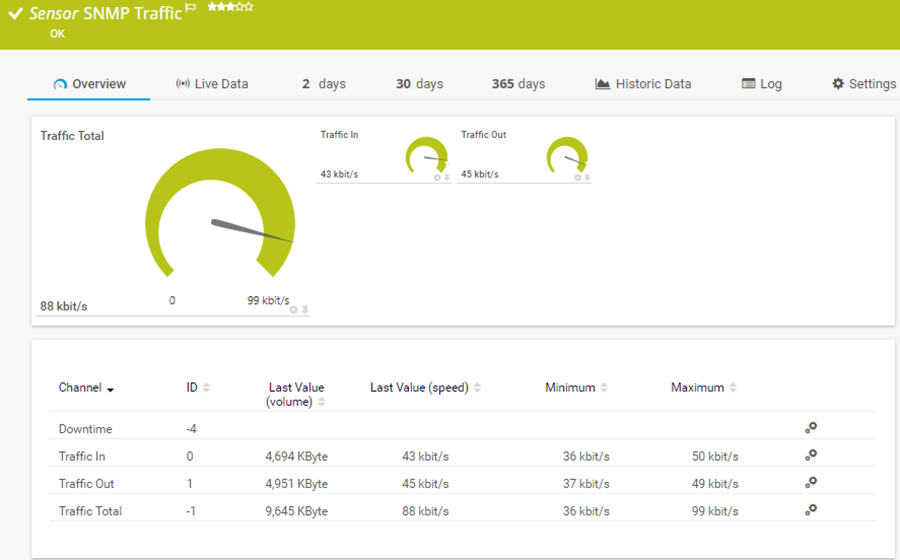
The SNMP Traffic sensor monitors traffic on a device via the Simple Network Management Protocol (SNMP).
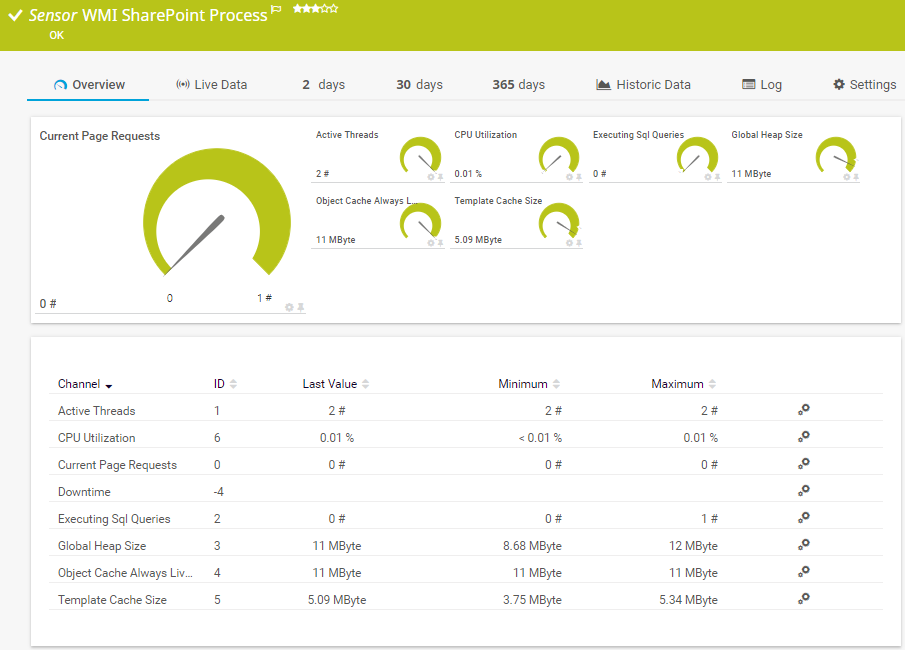
The WMI SharePoint Process sensor monitors a Microsoft SharePoint server via Windows Management Instrumentation (WMI).
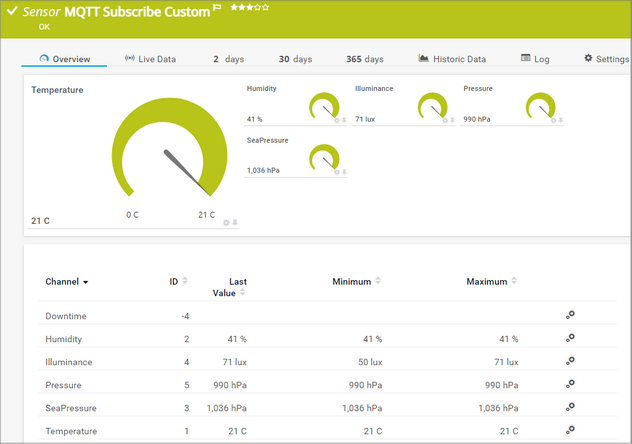
The MQTT Subscribe Custom sensor subscribes to a Message Queue Telemetry Transport (MQTT) topic and monitors up to ten numeric values from the received JavaScript Object Notation (JSON) data.


