• Company
    • About Us
    • Case Studies
    • Press Center
    • Events
    • Careers
    • Blog
    • Contact us
  • Contact us
  • Login
 
  • English
    • Deutsch
    • Español
    • Français
    • Italiano
    • Português
Paessler
                    - The Monitoring Experts
  • Products
    • Paessler PRTG
      Paessler PRTGMonitor your whole IT infrastructure
      • PRTG Network Monitor
      • PRTG Enterprise Monitor
      • PRTG Hosted Monitor
      • PRTG extensionsExtensions for Paessler PRTGExtend your monitoring to a new level
    • Icon Features
      FeaturesExplore all monitoring features
      • Maps & dashboards
      • Alerts & notifications
      • Multiple user interfaces
      • Distributed monitoring
      • Customizable reporting
  • Solutions
    • Industries
      IndustriesMonitor various industry sectors
      • Industrial
      • Healthcare
      • Data Center
      • Education
      • Finance
      • Government
    • IT Topics
      IT TopicsMonitor all areas of IT
      • Network Monitoring
      • Bandwidth Monitoring
      • SNMP Monitor
      • Network Mapping
      • WiFi Monitoring
      • Server Monitoring
  • Pricing
  • Resources
    • Getting Started
      Getting StartedModules for self-paced learning
    • How-to Guides
      How-to GuidesGet the most out of PRTG
    • Videos & Webinars
      Videos & WebinarsLearn from Paessler experts
    • IT  Knowledge
      IT KnowledgeExpand your IT knowledge
    • PRTG Manual
      PRTG ManualFull documentation
    • Knowledge Base
      Knowledge BaseShare community knowledge
    • PRTG Sensor Hub
      PRTG Sensor HubGet sensors, scripts & templates
    • Trainings
      PRTG TrainingLearn how to work with PRTG
  • Partners
    • icon star
      New Partners and MSPBecome a new partner or MSP
    • icon partner
      Partner PortalLog in to your partner account
    • Deal Registration
      Deal RegistrationRegister your sales opportunities
    • icon search
      Find a PartnerFind partners selling Paessler products
    • icon technology
      Technology AlliancesSee Paessler technology partnerships
  • Company
    • About Us
    • Case Studies
    • Press Center
    • Events
    • Careers
    • Blog
    • Contact us
  • Contact us
  • Login
  • English
    • Deutsch
    • Español
    • Français
    • Italiano
    • Português
  • Get a quote
  • Free trial
  1. Home>
  2. Paessler PRTG>
  3. Extensions for Paessler PRTG>
  4. Multi-Core Dashboards
PRTG Multi-Core Dashboard Logo

Multi-Core Dashboards: Enterprise-Level Visualization for Multi-Server Monitoring

Visualize data from multiple PRTG servers with powerful pre-configured Grafana® dashboards for different stakeholders. Exclusively available for PRTG Enterprise Monitor customers.

DISCOVER MORE
OverviewBenefitsFAQResources

Multi-Core Dashboards at a glance 

  • Consolidate monitoring data from multiple PRTG servers in centralized Grafana® dashboards
  • Utilize pre-configured dashboard templates that deliver professional visualizations without additional setup
  • Create tailored visualizations for every team with powerful filtering options that address different stakeholder needs
  • Access modern, visually appealing dashboards with intuitive navigation and interactive elements for an enhanced user experience
  • Seamlessly integrate with existing Grafana® installations or deploy new instances with guided setup wizards

PRTG Multi-Core Dashboards extends the functionality of Paessler PRTG

PRTG Multi-Core Dashboards is included with PRTG Enterprise Monitor subscriptions at no additional cost.

CHECK OUT PRTG

Hundreds of thousands of customers worldwide love Paessler PRTG

customer success stories


What customers say about us

Why PRTG Multi-Core Dashboards with Grafana® visualization is the perfect fit for you 

Grafana® dashboards

Grafana® dashboards ready to use


  • Access pre-configured Grafana® dashboards designed specifically for PRTG monitoring data
  • Display critical information in visually compelling formats without additional configuration
  • Cover a variety of monitoring scenarios, ranging from executive-level overviews to detailed technical views
Unified visibility

Unified visibility across multiple PRTG servers


  • Consolidate monitoring data from all your PRTG servers into centralized dashboards
  • Eliminate the need to switch between instances for immediate insights
  • Enable faster troubleshooting and better decision-making for your entire IT team
Visualizations for teams

Flexible customization for every team


  • Create tailored monitoring views for the various roles in your organization
  • Use powerful filtering options to focus on metrics relevant to each stakeholder
  • Segment data by location, device type, or service criticality
Flexible deployment

Quick deployment and seamless integration


  • Set up Multi-Core Dashboards with guided installation wizards and minimal configuration effort
  • Works with separately installed Grafana® instances or integrates with your existing Grafana® installations
  • Start visualizing data from multiple PRTG servers within minutes of installation

Have a sneak peek at PRTG Multi-Core Dashboards

Group Status dashboard

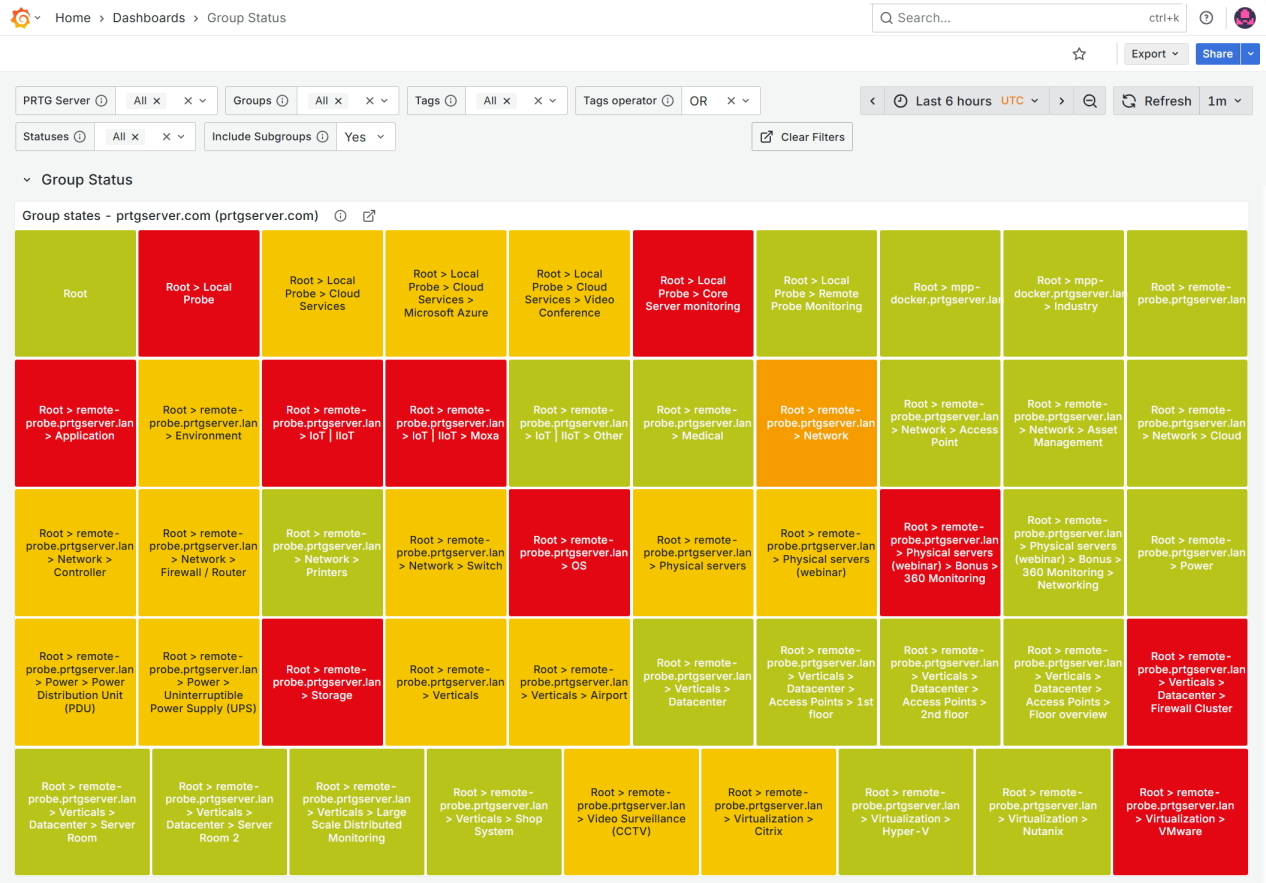
Shows the Group Status dashboard. This is a status dashboard. The screenshot shows all the groups from one server (including remote probes). Each group has its own square with the group status as the color of the square.

Probe Health dashboard

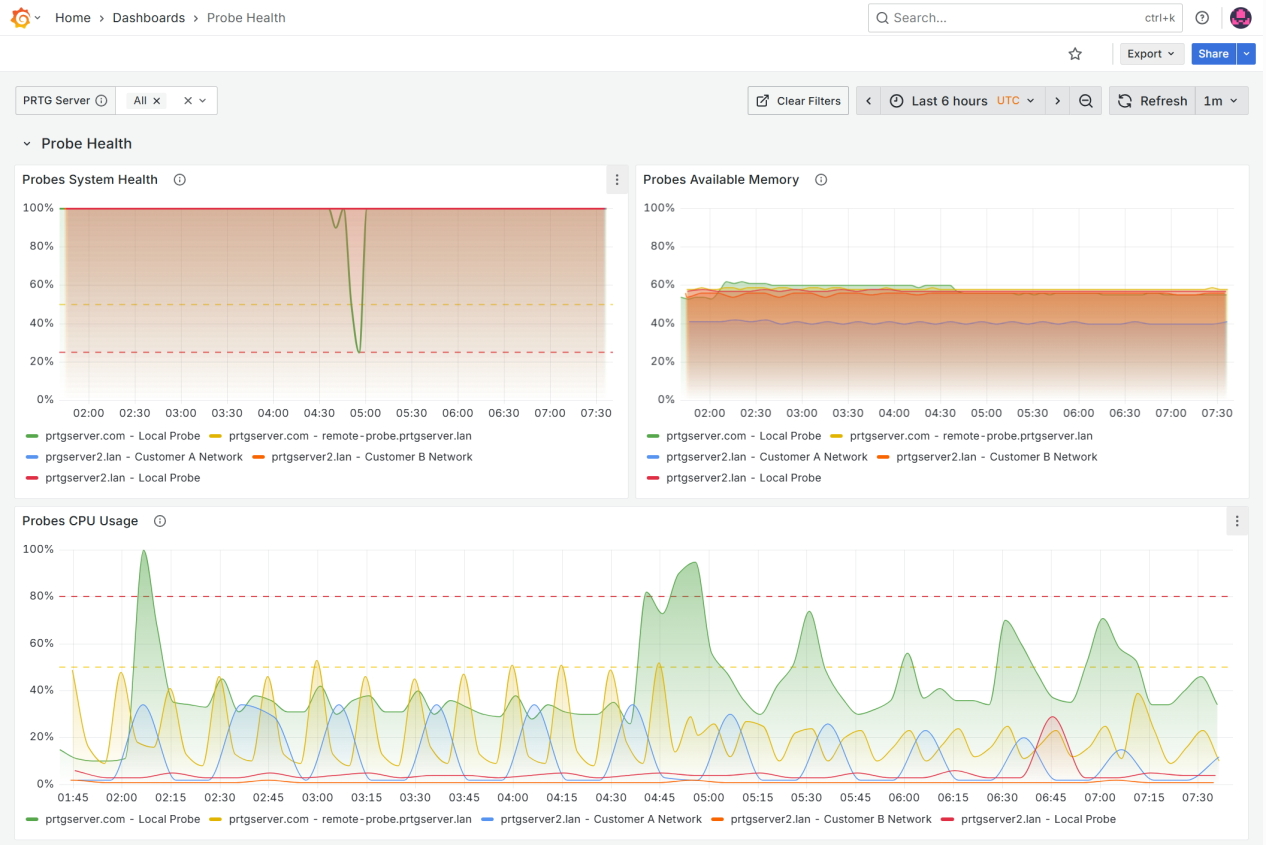
Shows the Probe Health dashboard. This is a metrics dashboard. The screenshot shows CPU usage, available memory, system health and free disk space for the local probes and remote probes of the two prtg servers configured with this grafana instance.

Sensor Status dashboard

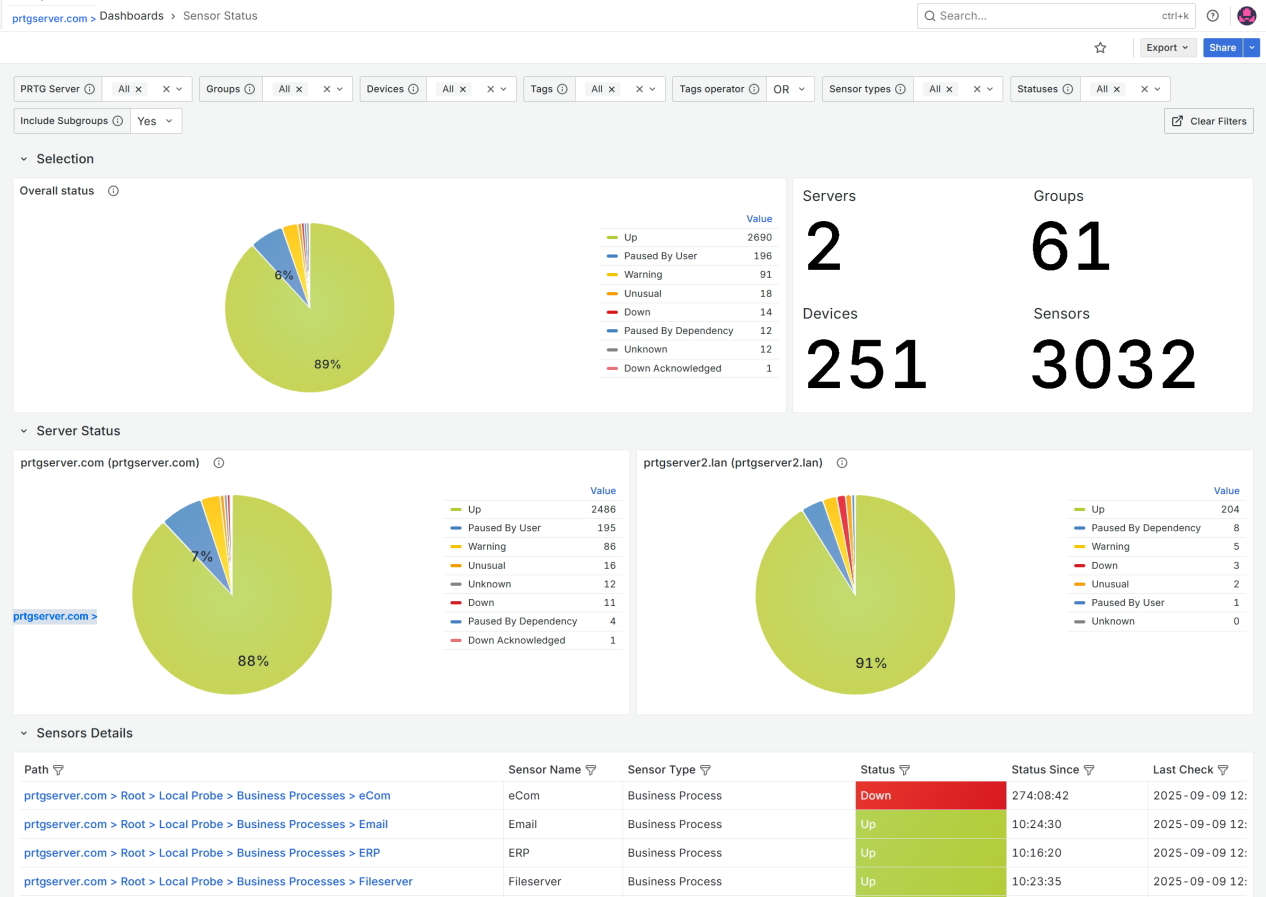
Shows the Sensor Status dashboard, but with more of the dashboard visible. This screenshot includes the Sensors Details table at the bottom of the screen.

Status Overview dashboard

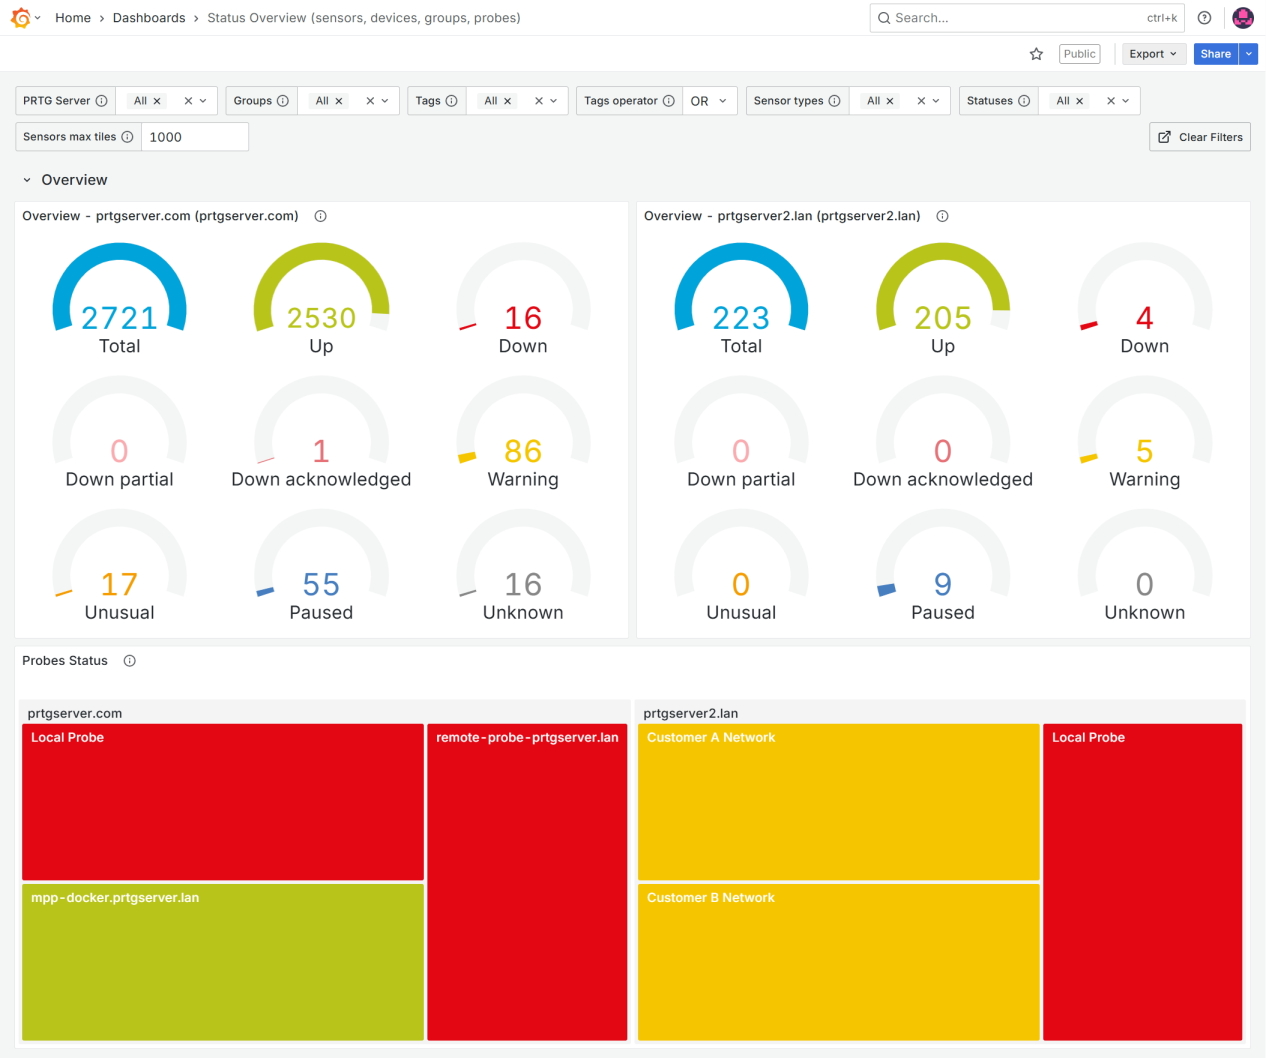
Shows the Status Overview dashboard. This is a status dashboard. The screenshot shows an overview of all the sensors in each server as well as the probe states of the local and remote probes in each server.

Benefit from powerful Grafana® visualizations for your PRTG monitoring data with PRTG Multi-Core Dashboards

DISCOVER MORE

Our users give top ratings for monitoring with Paessler PRTG

Gartner peer insights
spiceworks
G2
Capterra

PRTG Multi-Core Dashboards: FAQ

What is PRTG Multi-Core Dashboards?

PRTG Multi-Core Dashboards is a powerful extension for Paessler PRTG that enables enterprise-level visualization of monitoring data through Grafana® dashboards. It allows you to create unified views across multiple PRTG servers with pre-configured professional templates that display critical information in visually compelling formats. PRTG Multi-Core Dashboards uses PRTG Data Exporter as the underlying technology to extract and prepare your monitoring data for visualization.

Customization options are available for different teams and stakeholders in your organization, from executive-level overviews to detailed technical views.

Is PRTG Multi-Core Dashboards included in my PRTG Enterprise Monitor license?

Yes, PRTG Multi-Core Dashboards is included in your PRTG Enterprise Monitor subscription at no additional cost. This extension enables you to create unified Grafana® visualizations across multiple PRTG servers with pre-configured dashboard templates.

Do I need to install Grafana®?

Yes, Grafana® needs to be installed separately. You can download Grafana® from the official Grafana® downloads page.
Grafana® can be installed on the same server as PRTG Data Exporter or on a different server, depending on your infrastructure requirements.

Can I collect data from multiple PRTG servers into a single database?

Yes, this is one of the key features of PRTG Data Exporter. You can consolidate monitoring data from multiple PRTG servers into a single database, enabling unified dashboards that provide comprehensive visibility across your entire infrastructure.

What visualization options are available with PRTG Multi-Core Dashboards?

PRTG Multi-Core Dashboards provides a wide range of Grafana® visualization options including time-series graphs, gauges, tables, and heatmaps. The pre-configured templates offer immediate value for different stakeholders, while the flexibility of Grafana® allows you to create custom dashboards tailored to your specific monitoring needs.
PRTG Data Exporter works behind the scenes to extract and prepare your monitoring data for these visualizations.

What is an extension of Paessler PRTG?

A product extension of Paessler PRTG is separately licensed software that extends the feature set of the Paessler PRTG monitoring tools. To purchase and use a product extension, you need to own an active PRTG Network Monitor or PRTG Enterprise Monitor subscription or a perpetual PRTG Network Monitor license with active maintenance.

What is a sensor in PRTG?

In PRTG, “sensors” are the basic monitoring elements. One sensor usually monitors one measured value in your network, for example the traffic of a switch port, the CPU load of a server, or the free space on a disk drive. On average, you need about 5-10 sensors per device or one sensor per switch port.

Disclaimer Grafana®

PRTG Data Exporter streamlines the process of visualizing PRTG monitoring data by exporting it to standalone databases (MS SQL, PostgreSQL) that can be easily connected to Grafana® for powerful dashboard creation and data visualization via Grafana® APIs. Grafana® is a trademark of Grafana Labs. PRTG Data Exporter is not affiliated with or endorsed by Grafana Labs. 

Learning resources and help

Do you need more deep-dive information, or do you have any questions? Here you'll find what you are looking for. And if you'd like to talk to one of our experts, just contact us – we're always happy to help.

preview image manual

First steps

  • PRTG Data Exporter Manual (formerly PRTG Data Pump by Corp-IT) [PDF]
preview image tutorial

Technical details

  • System requirements for Paessler PRTG
preview image support

Support

  • Find a partner
  • Contact our team
PRTG Multi-Core Dashboard Logo
DISCOVER MORE

Products

  • Paessler PRTG
    Paessler PRTGMonitor your whole IT infrastructure
    • PRTG Network Monitor
    • PRTG Enterprise Monitor
    • PRTG Hosted Monitor
    • PRTG extensions
      Extensions for Paessler PRTGExtend your monitoring to a new level
  • Icon Features
    FeaturesExplore all monitoring features

Monitoring with PRTG

  • Network monitoring
  • Bandwidth monitoring
  • SNMP monitoring
  • Network mapping
  • Wi-Fi monitoring
  • Server monitoring
  • Network traffic analyzer
  • NetFlow monitoring
  • Syslog server

Useful Links

  • PRTG Manual
  • Knowledge Base
  • Customer Success Stories
  • About Paessler
  • Subscribe to newsletter
  • PRTG Support
  • PRTG Consulting
  • PRTG Feedback & Roadmap

Contact

Paessler GmbH
Thurn-und-Taxis-Str. 14, 
90411 Nuremberg 
Germany

info@paessler.com

+49 911 93775-0

  • Contact us
©2025 Paessler GmbHTerms & ConditionsPrivacy PolicyImprintReport VulnerabilityDownload & InstallSitemap
Multi-Core Dashboards Multi-Core Dashboards Multi-Core Dashboards