• Company
    • About Us
    • Case Studies
    • Press Center
    • Events
    • Careers
    • Blog
    • Contact us
  • Login
 
  • English
    • Deutsch
    • Español
    • Français
    • Italiano
    • Português
Paessler
                    - The Monitoring Experts
  • Products
    • Paessler PRTG
      Paessler PRTGMonitor your whole IT infrastructure
      • PRTG Network Monitor
      • PRTG Enterprise Monitor
      • PRTG Hosted Monitor
      • PRTG extensionsExtensions for Paessler PRTGExtend your monitoring to a new level
    • Icon Features
      FeaturesExplore all monitoring features
      • Maps & dashboards
      • Alerts & notifications
      • Multiple user interfaces
      • Distributed monitoring
      • Customizable reporting
  • Solutions
    • Industries
      IndustriesMonitor various industry sectors
      • Industrial
      • Healthcare
      • Data Center
      • Education
      • Finance
      • Government
    • IT Topics
      IT TopicsMonitor all areas of IT
      • Network Monitoring
      • Bandwidth Monitoring
      • SNMP Monitor
      • Network Mapping
      • WiFi Monitoring
      • Server Monitoring
  • Pricing
  • Resources
    • Getting Started
      Getting StartedModules for self-paced learning
    • How-to Guides
      How-to GuidesGet the most out of PRTG
    • Videos & Webinars
      Videos & WebinarsLearn from Paessler experts
    • IT  Knowledge
      IT KnowledgeExpand your IT knowledge
    • PRTG Manual
      PRTG ManualFull documentation
    • Knowledge Base
      Knowledge BaseShare community knowledge
    • PRTG Sensor Hub
      PRTG Sensor HubGet sensors, scripts & templates
    • Trainings
      PRTG TrainingLearn how to work with PRTG
  • Partners
    • icon star
      New Partners and MSPBecome a new partner or MSP
    • icon partner
      Partner PortalLog in to your partner account
    • icon search
      Find a PartnerFind partners selling Paessler products
    • icon technology
      Technology AlliancesSee Paessler technology partnerships
  • Company
    • About Us
    • Case Studies
    • Press Center
    • Events
    • Careers
    • Blog
    • Contact us
  • Login
  • English
    • Deutsch
    • Español
    • Français
    • Italiano
    • Português
  • Get a quote
  • Free trial
  1. Home>
  2. IT Topics>
  3. Virtualization>
  4. VLAN Monitoring Tool
PRTG Logo

VLAN Monitoring with PRTG

Optimize your virtual network segmentation with comprehensive VLAN monitoring

  • Detect and fix VLAN configuration issues before they affect your users
  • Monitor multiple VLANs, routers, and switches from a single dashboard
  • Get real-time visibility into VLAN traffic and performance
Free download
product overview

Our users give top ratings for monitoring with Paessler PRTG

Gartner peer insights
spiceworks
Capterra
G2
Trustpilot

PRTG VLAN monitoring: What you will find on this page

Table of content
  • Why you need VLAN monitoring with PRTG for your network
  • Solve your VLAN challenges with PRTG network monitoring
  • What VLAN monitoring looks like in PRTG
  • PRTG: your monitoring software for VLAN monitoring and network performance
  • Preconfigured PRTG sensors for VLAN monitoring
  • VLAN monitoring: FAQ

PRTG makes VLAN monitoring as easy as it gets

Custom alerts and data visualization let you quickly identify and prevent network issues, even in VLAN environments.

Free download
PRODUCT OVERVIEW

Why you need VLAN monitoring with PRTG for your network

Are VLANs a regular cause of headaches for you? That is not surprising, because without proper monitoring, these virtual networks can turn into a source of problems and security risks. That itself should be no surprise, since Virtual Local Area Networks (VLANs) are essential for efficient network segmentation, improved security, and optimized performance. Paessler PRTG offers comprehensive VLAN monitoring capabilities to ensure your network remains secure, efficient, and properly segmented.

Table of content

Solve your VLAN challenges with PRTG network monitoring

configuration

Fix VLAN configuration errors

Do VLAN misconfigurations keep you up at night? Do you want to make sure all your subnets are as accessible as you want them to be? Then it is time to relax, because PRTG has your back. It quickly spots incorrect VLAN IDs, tags, and switch port assignments. This means you can fix issues before they cause downtime or security breaches. PRTG provides you with all the knowledge you need to check VLAN trunking and routing, ensuring smooth communication across your network.

traffic

Optimize your VLAN traffic and bandwidth

Tired of unexpected bandwidth bottlenecks? PRTG gives you a clear view of your VLAN traffic patterns and utilization. It monitors both ingress and egress traffic for each VLAN in real-time, showing you exactly where bandwidth is used. Identify bottlenecks quickly and allocate resources effectively. PRTG tracks VLAN performance metrics continuously, helping you make informed decisions about your network infrastructure based on detailed, real-time data.

security

Enhance network security with VLAN monitoring

Worried about VLAN-related security risks? PRTG acts as your vigilant guardian for network segmentation and access control. You can detect the effect of your VLAN access control lists (ACLs) and firewall rules, alerting you to unauthorized access attempts immediately. PRTG ensures proper isolation between different VLANs, maintaining your network segmentation integrity and preventing unauthorized cross-VLAN communication. Keep your network environment secure across all your VLANs with PRTG.

What VLAN monitoring looks like in PRTG

Diagnose network issues by continuously tracking VLAN traffic. Show topology, network configuration, bandwidth, and other key metrics in real time. Visualize monitoring data in clear graphs and dashboards to identify problems more easily. Gain the overview you need to troubleshoot VLAN configuration issues and prevent performance problems.

PRTG Screenshot device tree view

Device tree view of the complete monitoring setup

PRTG screenshot map entire it infrastructure

Custom PRTG dashboard for keeping an eye on the entire IT infrastructure

PRTG screenshot graph live data traffic

Live traffic data graph in PRTG

Start monitoring your VLAN with PRTG and see how it can make your network more reliable and your job easier.

Free download
PRODUCT OVERVIEW

IT experts agree: Paessler PRTG is a great solution for IT infrastructure monitoring

PCMag

“All-around winning
 network monitor”

IT Brief

“The real beauty of PRTG is the endless possibilities it offers”

ITPro

“PRTG Network Monitor 
is very hard to beat”

PRTG: your monitoring software for VLAN monitoring and network performance

monitoring

Integrated SNMP and NetFlow monitoring

Want to understand your VLAN traffic better? PRTG uses SNMP to check VLAN setups on your switches and routers. It also analyzes NetFlow data to reveal VLAN traffic patterns. Need something specific? Create custom sensors tailored to your unique network needs.

multi vendor support

Multi-vendor support

Using equipment from different brands? No problem. PRTG works with Cisco, Juniper, HP, Dell, and many other major networking brands. You get consistent VLAN monitoring across your entire network, regardless of the hardware you use.

alerts

Customizable alerts and reporting

Never miss a critical VLAN event again. Set up alerts for VLAN-specific issues and choose how you want to be notified – email, SMS, or push notifications. PRTG also creates detailed reports on VLAN usage and performance, giving you the data you need to optimize your network and plan for future growth.

growth

Scalable monitoring for growing networks

As your network expands, PRTG grows with you, offering scalable network monitoring solutions for networks of all sizes. Monitor multiple VLANs across different locations, all from a single interface. As you add new network segments, PRTG adapts to your needs. You'll always have a clear view of your entire network, no matter how large or complex it becomes.

Explore our preconfigured PRTG sensors for VLAN monitoring

PRTG comes with more than 250 native sensor types for monitoring your entire on-premises, cloud, and hybrid cloud environment out of the box. Check out some examples below!

SNMP Traffic v2

The SNMP Traffic v2 sensor monitors bandwidth and traffic on a device. It can show the following:

  • Number of incoming and outgoing broadcast, multicast, unicast, and non-unicast packets
  • Number of incoming and outgoing discards and errors
  • Total, incoming, and outgoing traffic
  • Number of incoming, unknown protocols
SNMP Traffic v2
SNMP Traffic v2

SNMP RMON

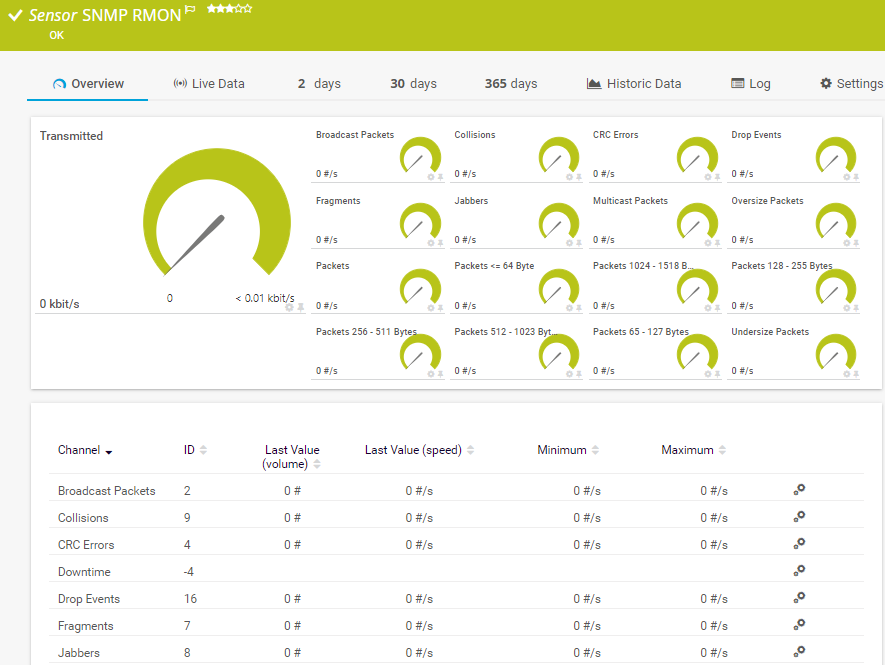
The SNMP RMON sensor monitors traffic on a device using the Remote Monitoring (RMON) standard. It can show the following:

  • Number of broadcast, multicast, undersize, and oversize packets
  • Number of collisions, CRC errors, and drop events
  • Number of fragments and jabbers
  • Number of packets with a specific amount of bytes
  • Transmitted bytes
SNMP RMON
SNMP RMON

SNMP Cisco System Health

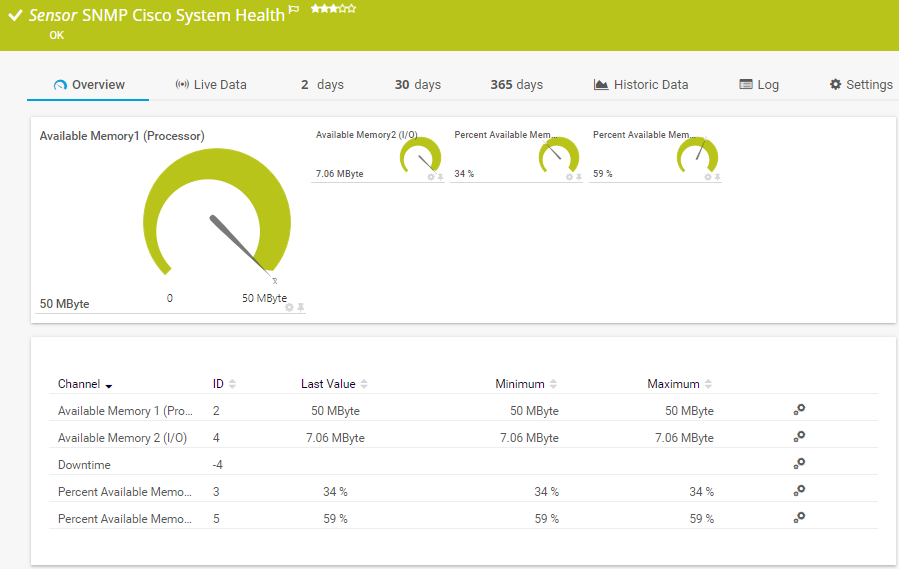
The SNMP Cisco System Health sensor monitors the system health of a Cisco device. It can show the following:

  • Available memory
  • CPU load
  • Fan status
  • Power supply status
SNMP Cisco System Health

Port Range

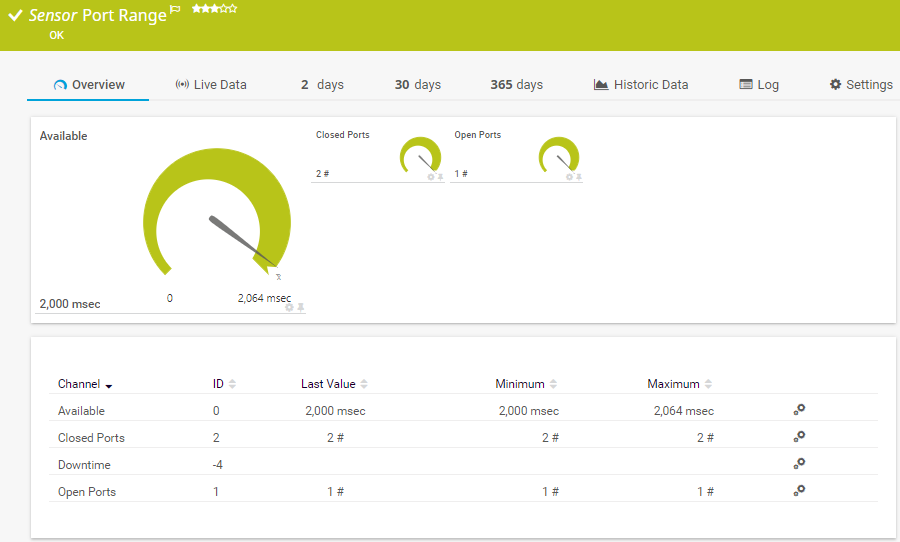
The Port Range sensor monitors a network service by connecting to various TCP/IP ports. It tries to connect to the specified TCP/IP port numbers of a device in succession and waits for the device to accept each request. It can show the following:

  • Time until requests to ports are accepted
  • Number of open and closed ports
Port Range
Port Range

See the PRTG Manual for a list of all available sensor types.

PRTG is compatible with all major vendors, products, and systems

compatible with all major vendors, products, and systems

PRTG makes VLAN monitoring as easy as it gets

Custom alerts and data visualization let you quickly identify and prevent network or performance issues in your VLANs.

Free download
PRODUCT OVERVIEW

“With PRTG, you get a centralized, intuitive, all-in-one tool that monitors the entire infrastructure. In the event of an error, the software immediately informs you by email. If you don’t hear from PRTG, you can sit back and relax, knowing everything is in order. Shortly after implementing PRTG, we were able to identify and eliminate performance bottlenecks in our VMware environment and load problems in our network.”

Steffen Ille, Head of Infrastructure, Service Center for Computer Systems and Communication
Bauhaus University Weimar

“The demands on our entire IT infrastructure have grown steadily in recent years. An important step towards the optimization of this environment involved the virtualization of our digital landscape. In order to maintain the required transparency and the uninterrupted performance of all our systems, we needed a powerful network monitoring tool. For us, the most important selection criteria were price-performance ratio and ease of use. PRTG met all our expectations and has proven to be an indispensable part of our network management.”

Daniel Baumgartner, Network Administrator
Volkswind

”As an international company, PRTG is ideal for us. If something went down half way across the world, we wouldn’t be woken up – we can rely on PRTG to identify the problem and alert us before it occurs – enabling the right person, in the right time zone to resolve the problem. At the end of the day, if we’re to provide an internal network experience for our employees that meets expectations, we need a tool like PRTG to be successful.”

Barry Kelly, Systems Engineer
Skyscanner

Your VLAN monitor at a glance – even on the go

PRTG is set up in a matter of minutes and can be used on a wide variety of mobile devices.

device overview
vmware

We are a VMware Technology Alliance Partner

Paessler achieved VMware's highest level of endorsement due to our technological excellence, leading market position, and superior compatibility with VMware products.

What does this mean for you?

  • Easy integration of VMware components with PRTG
  • State-of-the-art features for monitoring your virtual environment
  • Expert technical support around your VMware monitoring setup

Create innovative solutions with Paessler’s IT partners

Partnering with innovative IT vendors, Paessler unleashes synergies to create
new and additional benefits for joined customers.

IP Fabric

IP Fabric

Combining PRTG’s broad monitoring feature set with IP Fabric’s automated network assurance creates a new level of network visibility and reliability.

Read more
KnowledgeRiver

KnowledgeRiver

Combining their tools to a powerful solution for advanced analysis and automation, KnowledgeRiver and Paessler enable IT teams to ensure best performance for their infrastructure and networks.

Read more
Sigfox

Sigfox

Combine the functionality of Sigfox and Paessler for the most comprehensive, cost-effective, and easy-to-use IoT solution available.

Read more

Find the root cause of the problem with our PRTG VLAN monitoring solution

Real-time notifications mean faster troubleshooting so that you can act before more serious issues occur.

Free download
PRODUCT OVERVIEW
Paessler PRTG

Paessler PRTG

Network Monitoring Software – Version 24.4.102.1351 (November 12th, 2024)

Hosting icon

Hosting

Download for Windows and cloud-based version PRTG Hosted Monitor available

Languages icon

Languages

English, German, Spanish, French, Portuguese, Dutch, Russian, Japanese, and Simplified Chinese

test

Monitor everything

Network devices, bandwidth, servers, applications, virtual environments, remote systems, IoT, and more

test

Pricing

Choose the PRTG Network Monitor subscription that's best for you

VLAN Monitoring: FAQ


What is VLAN monitoring?

VLAN monitoring is the process of tracking and analyzing the performance, traffic, and configuration of Virtual Local Area Networks (VLANs) within a network infrastructure. It involves observing VLAN traffic patterns, ensuring proper VLAN configurations, and maintaining network segmentation and security.

Why is VLAN monitoring important?

VLAN monitoring is crucial for maintaining an efficient and secure network. It helps network administrators detect configuration errors, optimize bandwidth usage, enhance security through proper segmentation, and quickly troubleshoot VLAN-related issues. Effective VLAN monitoring ensures that your network performs optimally and remains protected against potential security threats.

How does PRTG monitor VLANs?

PRTG uses various technologies to monitor VLANs comprehensively:

  • SNMP polling to gather VLAN configuration and status information from switches and routers
  • NetFlow analysis to examine VLAN traffic patterns and bandwidth usage
  • Packet sniffing for detailed VLAN traffic inspection
  • Custom sensors for specific VLAN monitoring requirements

PRTG combines these technologies to provide a holistic view of your VLAN performance and health.

Can PRTG monitor multiple VLANs simultaneously?

Yes, PRTG can monitor multiple VLANs across your entire network infrastructure simultaneously. Its scalable architecture allows you to monitor hundreds or even thousands of VLANs from a single PRTG instance, providing a centralized view of your entire virtual network environment.

How does VLAN monitoring improve network security?

VLAN monitoring enhances network security by:

  • Ensuring proper VLAN segmentation and isolation
  • Detecting unauthorized access attempts between VLANs
  • Monitoring VLAN access control lists (ACLs) and firewall rules
  • Identifying potential security breaches through abnormal traffic patterns

By maintaining strict VLAN boundaries and monitoring inter-VLAN communication, collecting data with PRTG helps you maintain a secure network environment.

What is a sensor in PRTG?

In PRTG, “sensors” are the basic monitoring elements. One sensor usually monitors one measured value in your network, for example the traffic of a switch port, the CPU load of a server, or the free space on a disk drive. On average, you need about 5-10 sensors per device or one sensor per switch port.

We asked: would you recommend PRTG? Over 95% of our customers say yes!

Paessler conducted trials in over 600 IT departments worldwide to tune its network monitoring software closer to the needs of sysadmins. The result of the survey: over 95% of the participants would recommend PRTG – or already have.

recommendation

Still not convinced?

Love

More than 500,000 sysadmins love PRTG

Paessler PRTG is used by companies of all sizes. Sysadmins love PRTG because it makes their job a whole lot easier.

PRTG

Monitor your entire IT infrastructure

Bandwidth, servers, virtual environments, websites, VoIP services – PRTG keeps an eye on your entire network.

test

Try Paessler PRTG for free

Everyone has different monitoring needs. That’s why we let you try PRTG for free.

PRTG Logo

Start VLAN monitoring with PRTG and see how it can make your network more reliable and your job easier.

Free download
PRODUCT OVERVIEW

Products

  • Paessler PRTG
    Paessler PRTGMonitor your whole IT infrastructure
    • PRTG Network Monitor
    • PRTG Enterprise Monitor
    • PRTG Hosted Monitor
    • PRTG extensions
      Extensions for Paessler PRTGExtend your monitoring to a new level
  • Icon Features
    FeaturesExplore all monitoring features

Monitoring with PRTG

  • Network monitoring
  • Bandwidth monitoring
  • SNMP monitoring
  • Network mapping
  • Wi-Fi monitoring
  • Server monitoring
  • Network traffic analyzer
  • NetFlow monitoring
  • Syslog server

Useful Links

  • PRTG Manual
  • Knowledge Base
  • Customer Success Stories
  • About Paessler
  • Subscribe to newsletter
  • PRTG Support
  • PRTG Consulting

Contact

Paessler GmbH
Thurn-und-Taxis-Str. 14, 
90411 Nuremberg 
Germany

info@paessler.com

+49 911 93775-0

  • Contact us
©2025 Paessler GmbHTerms & ConditionsPrivacy PolicyImprintReport VulnerabilityDownload & InstallSitemap
404 - Page not found 404 - Page not found 404 - Page not found