• Company
    • About Us
    • Case Studies
    • Press Center
    • Events
    • Careers
    • Blog
    • Contact us
  • Login
 
  • English
    • Deutsch
    • Español
    • Français
    • Italiano
    • Português
Paessler
                    - The Monitoring Experts
  • Products
    • Paessler PRTG
      Paessler PRTGMonitor your whole IT infrastructure
      • PRTG Network Monitor
      • PRTG Enterprise Monitor
      • PRTG Hosted Monitor
      • PRTG extensionsExtensions for Paessler PRTGExtend your monitoring to a new level
    • Icon Features
      FeaturesExplore all monitoring features
      • Maps & dashboards
      • Alerts & notifications
      • Multiple user interfaces
      • Distributed monitoring
      • Customizable reporting
  • Solutions
    • Industries
      IndustriesMonitor various industry sectors
      • Industrial
      • Healthcare
      • Data Center
      • Education
      • Finance
      • Government
    • IT Topics
      IT TopicsMonitor all areas of IT
      • Network Monitoring
      • Bandwidth Monitoring
      • SNMP Monitor
      • Network Mapping
      • WiFi Monitoring
      • Server Monitoring
  • Pricing
  • Resources
    • Getting Started
      Getting StartedModules for self-paced learning
    • How-to Guides
      How-to GuidesGet the most out of PRTG
    • Videos & Webinars
      Videos & WebinarsLearn from Paessler experts
    • IT  Knowledge
      IT KnowledgeExpand your IT knowledge
    • PRTG Manual
      PRTG ManualFull documentation
    • Knowledge Base
      Knowledge BaseShare community knowledge
    • PRTG Sensor Hub
      PRTG Sensor HubGet sensors, scripts & templates
    • Trainings
      PRTG TrainingLearn how to work with PRTG
  • Partners
    • icon star
      New Partners and MSPBecome a new partner or MSP
    • icon partner
      Partner PortalLog in to your partner account
    • icon search
      Find a PartnerFind partners selling Paessler products
    • icon technology
      Technology AlliancesSee Paessler technology partnerships
  • Company
    • About Us
    • Case Studies
    • Press Center
    • Events
    • Careers
    • Blog
    • Contact us
  • Login
  • English
    • Deutsch
    • Español
    • Français
    • Italiano
    • Português
  • Get a quote
  • Free trial
  1. Home>
  2. IT Topics>
  3. Performance>
  4. Network Jitter Test
PRTG Logo

Network Jitter Test with PRTG

Keep the quality of your communications going strong

  • Get a complete picture of your network’s performance
  • Respond quickly to network issues and stay proactive
  • Optimize your network and do away with high jitter and latency
Free download
product overview

Our users give top ratings for monitoring with Paessler PRTG

Gartner peer insights
spiceworks
Capterra
G2
Trustpilot

PRTG network jitter test: What you will find on this page

Table of content
  • Get the extra support you need for steady communications with PRTG jitter testing
  • What network jitter testing looks like in PRTG
  • 4 more reasons to choose PRTG as your network jitter test tool
  • Explore our preconfigured PRTG sensors for testing network jitter
  • Network Jitter Test: FAQ

PRTG makes network jitter testing as easy as it gets

Custom alerts and data visualization let you quickly identify and prevent network performance issues.

Free download
PRODUCT OVERVIEW

Get the extra support you need for steady communications with PRTG jitter testing

Higher jitter increases the likelihood of experiencing choppy audio, dropped calls, lagging video conferencing, and poor network performance in general. Yet, watching every bit and byte of network data is a full-time job. Paessler PRTG is your extra team support, ready to make it easier to measure, analyze, and address all kinds of jitter issues.

Help your organization talk the talk

Real-time communications are very sensitive to network performance issues. Even small variations in packet arrival times, known as jitter, can lead to a serious breakdown in the quality of these services.

PRTG helps your voice and video communications stay clear, in sync, and free of interruptions. PRTG has you covered from installation to endpoints.

Make “proactive” a monitoring mantra

Being proactive can often feel like hit and miss. How often have you tried proactive network management and put your efforts in the wrong place?

PRTG’s jitter testing is a key component of proactive management, but with comprehensive insights, historical data, and customizable reporting, you no longer have to guess. Use PRTG for all your proactive monitoring needs. No safety net needed.

Optimize your network performance

Understanding jitter patterns and their causes allows you to fine-tune your network configurations. For example, you can adjust quality of service (QoS) settings to put real-time traffic first, upgrade hardware, or increase bandwidth.

PRTG jitter testing prepares your network to handle the demands of real-time communications effectively.

Unfreeze business communications

Nobody wants to stare at a frozen video of their co-worker or struggle to catch all the words being said at a Zoom meeting because of choppy audio.

Use PRTG to regularly test for high jitter and address issues as fast as possible. This will not only enhance overall user experience, but also lead to higher productivity and satisfaction.

Maintain your service level agreements

Maintaining SLAs is essential when your organization provides network services or relies on third-party providers.

As service level agreements often include guarantees for network performance metrics such as jitter, network latency, and packet loss, PRTG helps you stay in compliance with your SLAs, avoid penalties, and maintain trust with clients and partners.

What network jitter testing looks like in PRTG

Diagnose network issues by continuously tracking your network’s performance. Show jitter, latency, bandwidth usage, response time, network traffic and VoIP traffic, and other key metrics in real time. Visualize monitoring data in clear graphs and dashboards to identify problems more easily. Gain the overview you need to troubleshoot network congestions, bandwidth hogs, and other performance issues.

PRTG Screenshot device tree view

Device tree view of the complete monitoring setup

PRTG screenshot map entire it infrastructure

Custom PRTG dashboard for keeping an eye on the entire IT infrastructure

PRTG screenshot graph live data traffic

Live traffic data graph in PRTG

Start testing network jitter with PRTG and see how it can make your network more reliable and your job easier.

Free download
PRODUCT OVERVIEW

IT experts agree: Paessler PRTG is a great solution for IT infrastructure monitoring

PCMag

“All-around winning
 network monitor”

IT Brief

“The real beauty of PRTG is the endless possibilities it offers”

ITPro

“PRTG Network Monitor 
is very hard to beat”

4 more reasons to choose PRTG as your network jitter test tool

Icon eye

You like to see the whole picture

It wouldn't be nearly as interesting if you could only see part of Mona Lisa’s smile. Don’t be bored with your jitter testing; get the whole picture.

PRTG gives you an in-depth analysis of jitter, latency, and packet loss. So, you get the data you need to make a real difference to network performance.

Icon warning

You want to solve network issues

Who wants to spend their weekends troubleshooting jitter and latency issues? We recognize that weekends and nights are important for R&R, so we’ve worked hard to make PRTG a fast “resolution solution.”

Get all the data you need to identify when an issue occurs quickly, pinpoint where the issue is, and resolve it – down to the application and process level.

Icon alarm bell

You like to relax outside of the office

PRTG comes with real-time alerts that sound the alarm when jitter exceeds the thresholds you set. Customize these alerts to go to key stakeholders at specific thresholds using a set delivery method.

Notifications can be delivered over email, SMS, push notifications, Slack, and more. With PRTG on the watch, you can finally leave the office without worrying about the network.

Icon setup

You like easy network monitoring

PRTG is easy to set up. In most instances, all it takes is a few clicks and minutes to start monitoring your network “out of the box.”

Over and over, our customers mention ease of use, ease of setup, and how easy it is to understand the central dashboard as part of the reason they keep PRTG in their tech stack. No PhD needed to implement.

Explore our preconfigured PRTG sensors for testing network jitter

PRTG comes with more than 250 native sensor types for monitoring your entire on-premises, cloud, and hybrid cloud environment out of the box. Check out some examples below!

Ping Jitter

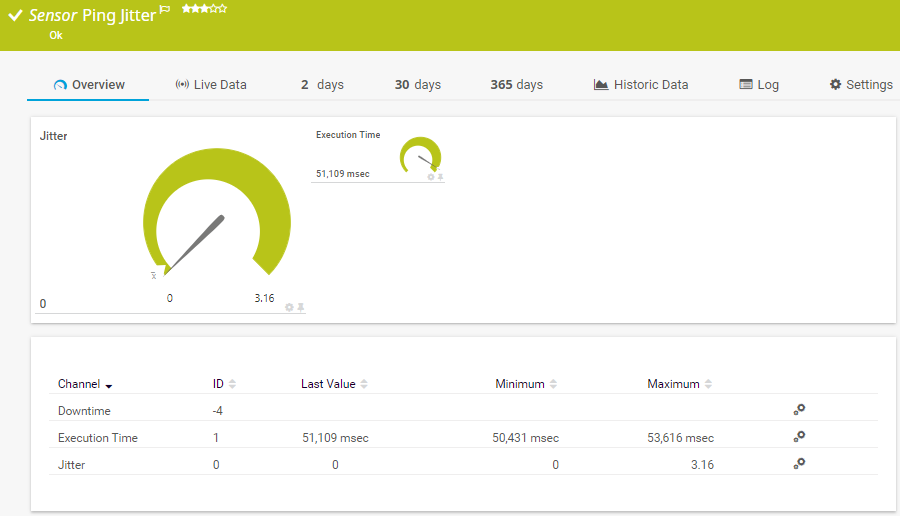
The Ping Jitter sensor sends a series of Internet Control Message Protocol (ICMP) echo requests ("pings") to a URI to determine the statistical jitter. It can show the following:

  • Execution time
  • Statistical jitter value
Ping Jitter
Ping Jitter

QoS (Quality of Service) One Way

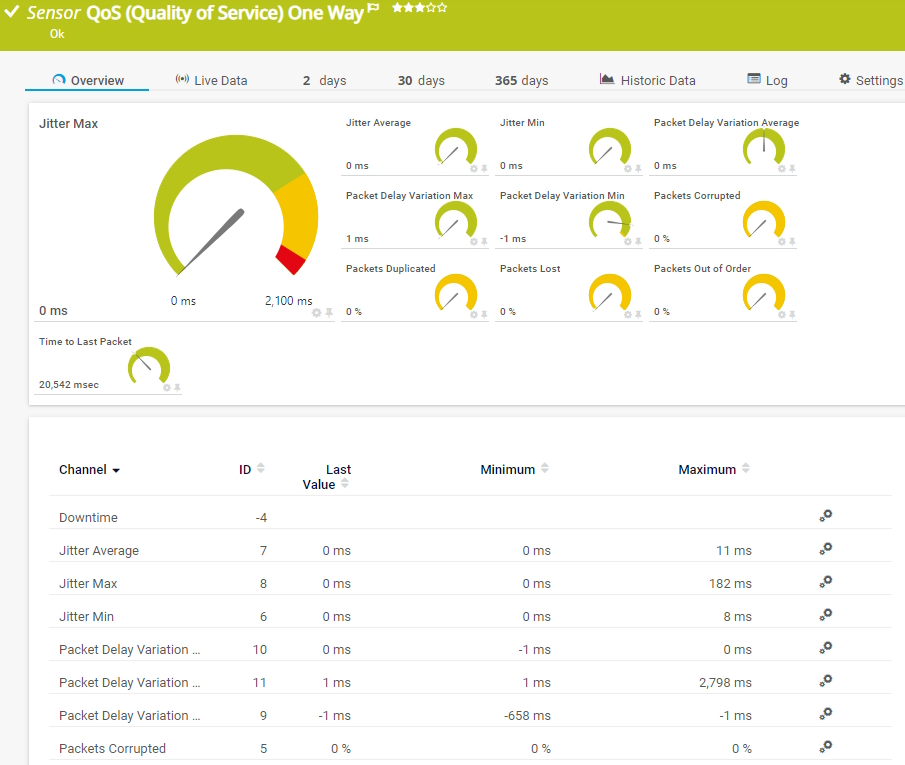
The QoS (Quality of Service) One Way sensor monitors parameters regarding the quality of a network connection between two probes. It can show the following:

  • Average, minimum, and maximum jitter
  • Average, minimum, and maximum packet delay variation
  • Corrupted, duplicated, lost, and out-of-sequence packets
  • Time to the last packet
(Quality of Service) One Way

QoS (Quality of Service) Round Trip

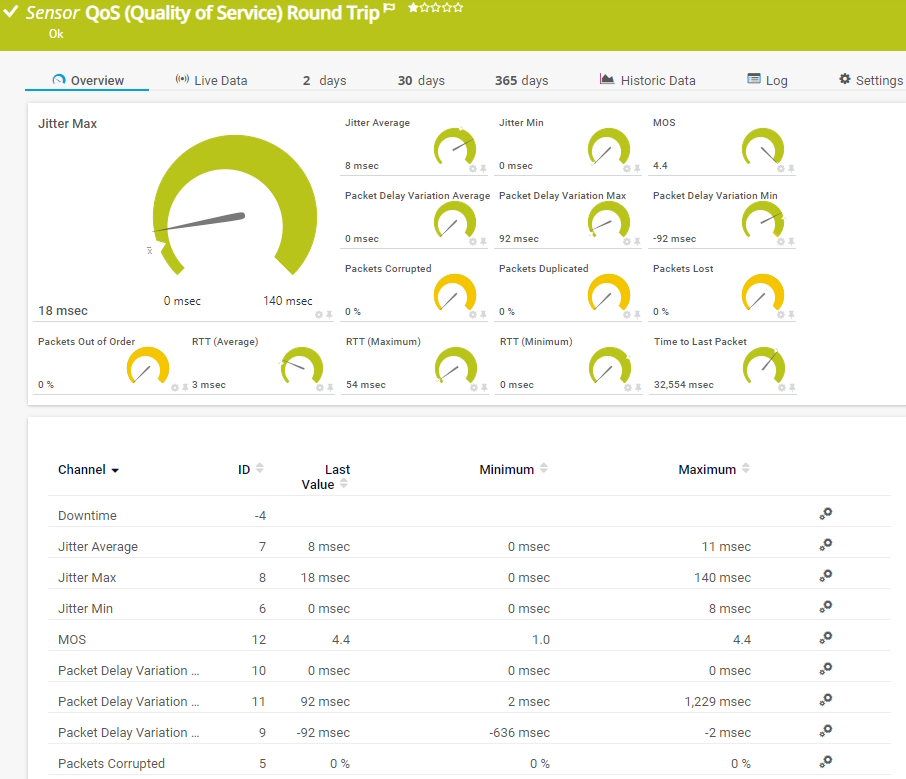
The QoS (Quality of Service) Round Trip sensor monitors parameters regarding the quality of a network connection between two probes. It can show the following:

  • Average, minimum, and maximum jitter
  • Average, minimum, and maximum packet delay variation
  • Average, minimum, and maximum round trip time (RTT)
  • Corrupted, duplicated, lost, and out-of-sequence packets
  • The MOS
(Quality of Service) Round Trip

Cisco IP SLA

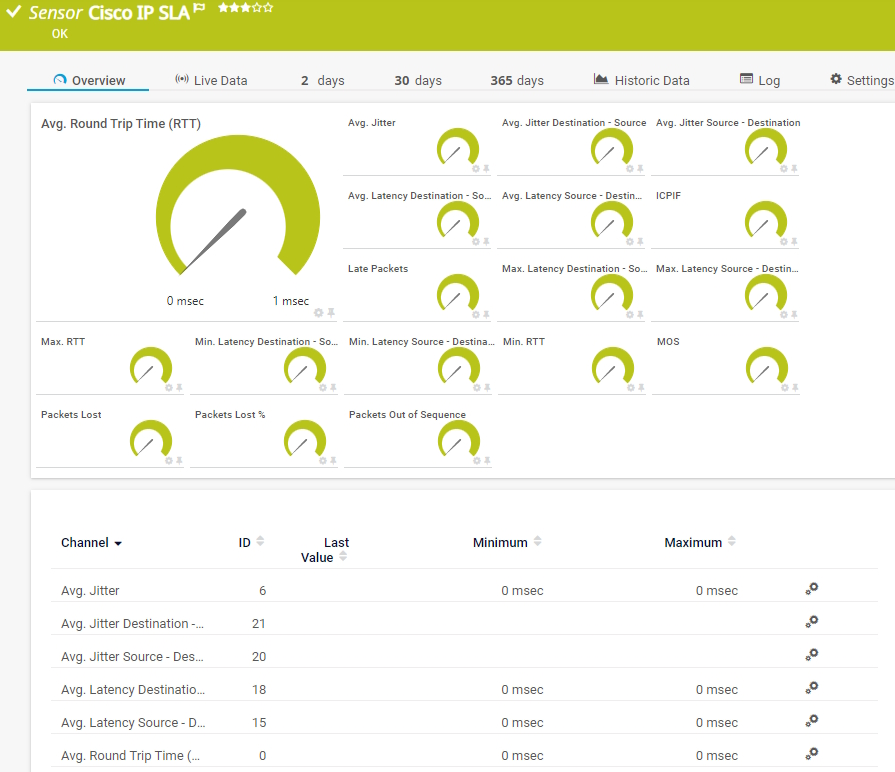
The Cisco IP SLA sensor monitors Voice over IP (VoIP) network parameters using IP service level agreements (SLA) from Cisco. It can show the following:

  • Average jitter
  • Average, minimum, and maximum latency and RTT (round-trip time)
  • The ICPIF
  • The MOS
  • Number of lost, out-of-sequence, and late packets
Cisco IP SLA
Cisco IP SLA

See the PRTG Manual for a list of all available sensor types.

PRTG is compatible with all major vendors, products, and systems

compatible with all major vendors, products, and systems

PRTG makes network jitter testing as easy as it gets

Custom alerts and data visualization let you quickly identify and prevent network performance issues.

Free download
PRODUCT OVERVIEW

“PRTG helps us to keep control of our IT by making issues visible immediately – and everywhere. We always have an eye on the performance and availability of our IT and can react in time if any failures occur. On a long-term perspective, the monitoring data helps us with capacity planning so that we can deliver the required resources for our own systems as well as for our customers, without wasting money on unwarranted redundancies.”

Stein Erik Høybakk, Senior Network Engineer
TAFJORD

“All our production and business processes depend on SAP. But, of course, IT and production systems also play a crucial role in securing these processes. By incorporating SAP, production, and IT into one centralized monitoring system, we can quickly detect critical drops in performance and identify the causes of these issues. In fact, thanks to PRTG and itesys, this couldn’t be any easier.”

Andreas Schmidt, Senior Systems Engineer
Truma

“Any downtime could be detrimental to our customers. We also strive to provide the best possible service to our customers. PRTG allows us to see the health and performance of the network. Using these measurements we can make decisions on how to repair a piece of equipment before it fails and causes a service interruption.”

James Ott Jr., Communications System Technician and IT Administrator
Federal Radio

Your network jitter tester at a glance – even on the go

PRTG is set up in a matter of minutes and can be used on a wide variety of mobile devices.

device overview
Gartner peer insights

“Excellent tool for detailed monitoring. Alarms and notifications work greatly. Equipment addition is straight forward and server initial setup is very easy. ...feel safe to purchase it if you intend to monitor a large networking landscape.”

Read the complete review at Gartner Peer Insights

Create innovative solutions with Paessler’s IT partners

Partnering with innovative IT vendors, Paessler unleashes synergies to create
new and additional benefits for joined customers.

Rittal

Rittal

IT that works constitutes a business-critical basis for a company's success. Availability and security must be defined for the respective purpose and closely monitored – by OT and IT alike.

Read more
NetBrain

NetBrain

Integrating monitoring results from PRTG into NetBrain maps makes the foundation for network automation.

Read more
ScriptRunner

ScriptRunner

With ScriptRunner Paessler integrates a powerful event automation platform into PRTG Network Monitor.

Read more

Find the root cause of the problem with our PRTG network jitter test solution

Real-time notifications mean faster troubleshooting so that you can act before more serious issues occur.

Free download
PRODUCT OVERVIEW
Paessler PRTG

Paessler PRTG

Network Monitoring Software – Version 24.4.102.1351 (November 12th, 2024)

Hosting icon

Hosting

Download for Windows and cloud-based version PRTG Hosted Monitor available

Languages icon

Languages

English, German, Spanish, French, Portuguese, Dutch, Russian, Japanese, and Simplified Chinese

test

Monitor everything

Network devices, bandwidth, servers, applications, virtual environments, remote systems, IoT, and more

test

Pricing

Choose the PRTG Network Monitor subscription that's best for you

Discover more monitoring insights and stories

Resources Solution

Solutions for all your monitoring needs

  • Jitter Monitoring
  • The monitoring solution for all areas of IT!
  • Network Performance Test Tool
Resources Content

Powerful stories from the monitoring world

  • How Can I Monitor My Available Bandwidth 24/7?
  • How to quickly monitor the latency of your network
  • Why monitor Unified Communications quality?
Resources Solutions

Resources to master your monitoring challenges

  • IP SLA icmp-jitter test not recognised
  • tests to default gateway
  • PRTG does not work with path-jitter

Network Jitter Test: FAQ


What is network jitter?

Network jitter is the deviation from the average amount of time a data packet needs to travel from its starting point to its destination. High jitter values can cause noticeable delays and transmission errors (such as background noise and faulty audio signals), in particular when it comes to real-time services such as VoIP. No network is completely free of jitter. The important thing is that you keep jitter to a minimum.

Why should I do a network jitter test?

Network jitter tests are a good way to check the quality of your connection. Among other things, these tests will help you determine whether your Internet Service Provider (ISP) is fulfilling the terms of your service level agreement (SLA), or if you need to increase your bandwidth. 

What does a network jitter test look at?

PRTG’s network jitter test measures packet delay variation, the average jitter over time, packet loss rate, latency and round trip time (RTT), traffic patterns, and traffic congestion. 

Can PRTG test jitter on all types of networks?

Yes. PRTG can test jitter on several network types, including your LAN, WAN, virtual and cloud-based networks, and more.

What is considered an acceptable level of jitter?

For VoIP and video conferencing, jitter should ideally be below 30 milliseconds. Higher levels can cause noticeable interruptions.

Does PRTG also provide jitter monitoring?

Yes! PRTG has specific sensors designed to measure, monitor, and analyze jitter. PRTG as a jitter monitoring tool helps identify and resolve issues that cause delays, poor audio, video, and VoIP call quality, slow download speeds, and other performance problems.

What is a sensor in PRTG?

In PRTG, “sensors” are the basic monitoring elements. One sensor usually monitors one measured value in your network, for example the traffic of a switch port, the CPU load of a server, or the free space on a disk drive. On average, you need about 5-10 sensors per device or one sensor per switch port.

We asked: would you recommend PRTG? Over 95% of our customers say yes!

Paessler conducted trials in over 600 IT departments worldwide to tune its network monitoring software closer to the needs of sysadmins. The result of the survey: over 95% of the participants would recommend PRTG – or already have.

recommendation

Still not convinced?

Love

More than 500,000 sysadmins love PRTG

Paessler PRTG is used by companies of all sizes. Sysadmins love PRTG because it makes their job a whole lot easier.

PRTG

Monitor your entire IT infrastructure

Bandwidth, servers, virtual environments, websites, VoIP services – PRTG keeps an eye on your entire network.

test

Try Paessler PRTG for free

Everyone has different monitoring needs. That’s why we let you try PRTG for free.

PRTG Logo

Start testing network jitter with PRTG and see how it can make your network more reliable and your job easier.

Free download
PRODUCT OVERVIEW

Products

  • Paessler PRTG
    Paessler PRTGMonitor your whole IT infrastructure
    • PRTG Network Monitor
    • PRTG Enterprise Monitor
    • PRTG Hosted Monitor
    • PRTG extensions
      Extensions for Paessler PRTGExtend your monitoring to a new level
  • Icon Features
    FeaturesExplore all monitoring features

Monitoring with PRTG

  • Network monitoring
  • Bandwidth monitoring
  • SNMP monitoring
  • Network mapping
  • Wi-Fi monitoring
  • Server monitoring
  • Network traffic analyzer
  • NetFlow monitoring
  • Syslog server

Useful Links

  • PRTG Manual
  • Knowledge Base
  • Customer Success Stories
  • About Paessler
  • Subscribe to newsletter
  • PRTG Support
  • PRTG Consulting

Contact

Paessler GmbH
Thurn-und-Taxis-Str. 14, 
90411 Nuremberg 
Germany

info@paessler.com

+49 911 93775-0

  • Contact us
©2025 Paessler GmbHTerms & ConditionsPrivacy PolicyImprintReport VulnerabilityDownload & InstallSitemap
404 - Page not found 404 - Page not found 404 - Page not found