Custom alerts and data visualization make it easy to monitor, identify, and prevent bandwidth and other performance issues.
Understanding network traffic is not simple. Where are the bottlenecks? Which are the top IP addresses creating the most network traffic? How can you spot potential problems before they cause downtime or annoy users? For Cisco hardware, using the NetFlow protocol is one of the most tried and trusted approaches for understanding traffic flow. And with the NetFlow traffic analyzer capabilities of Paessler PRTG monitoring software, it’s never been easier.
Diagnose network issues by continuously monitoring and inspecting network flows in detail. Show bandwidth utilization and bottlenecks in real time. Visualize monitoring data in clear graphs and dashboards to identify problems more easily. Gain the overview you need to troubleshoot traffic flow issues and prevent downtime.

Device tree view of the complete monitoring setup
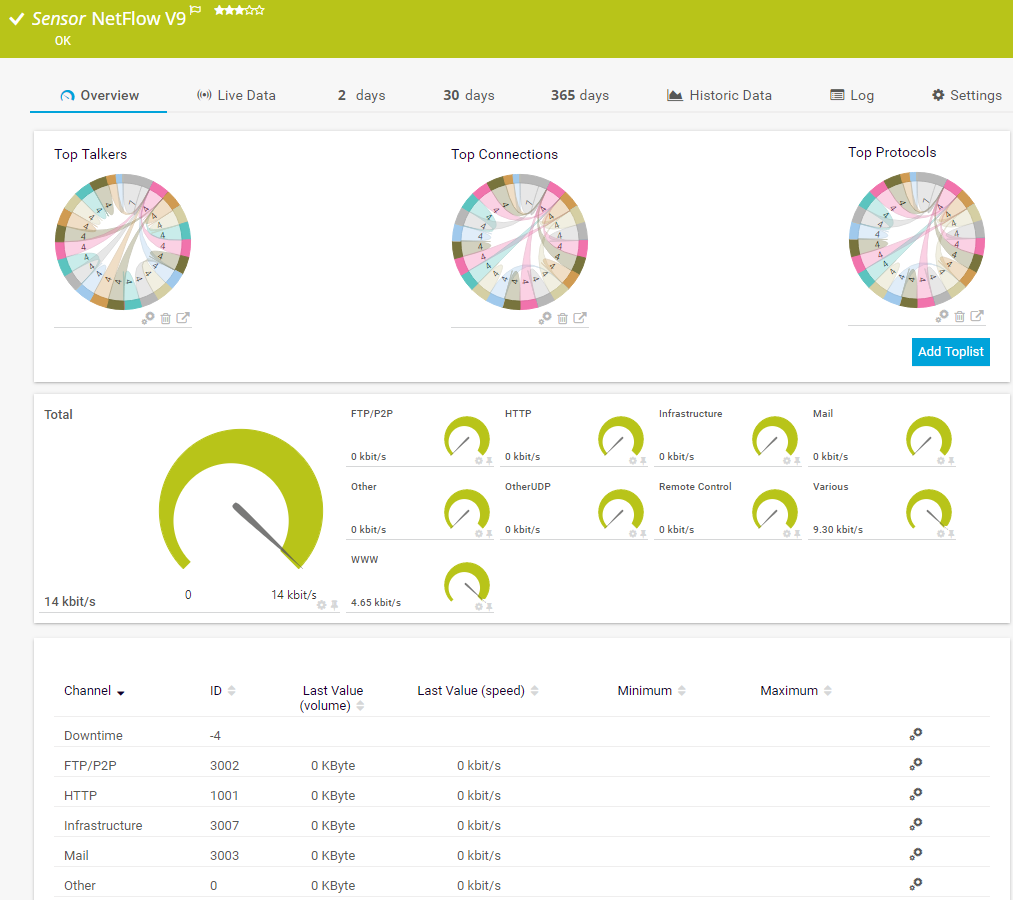
Preconfigured NetFlow v9 sensor in PRTG

Custom PRTG dashboard for keeping an eye on the entire IT infrastructure
“All-around winning
network monitor”
“The real beauty of PRTG is the endless possibilities it offers”
“PRTG Network Monitor
is very hard to beat”
PRTG features sensors that use NetFlow v5, NetFlow v9, and IPFIX– all preconfigured and ready to use right away. View your network traffic by IP address, protocol, or user at a glance, and deploy several filter options to divide traffic into different channels.
Customizable PRTG dashboards give you the ability to visualize your network traffic analysis in the way you and your teams need to see it. You can even publish dashboards on your NOC screen or anywhere you like so that you always have the traffic data at your fingertips.
With custom sensors and support for common protocols, you can monitor everything with our fully-featured monitoring tool: from network devices like routers and firewalls through to applications and cloud infrastructure.
PRTG comes with more than 2250 native sensor types for monitoring your entire on-premises, cloud, and hybrid cloud environment out of the box. Check out some examples below!
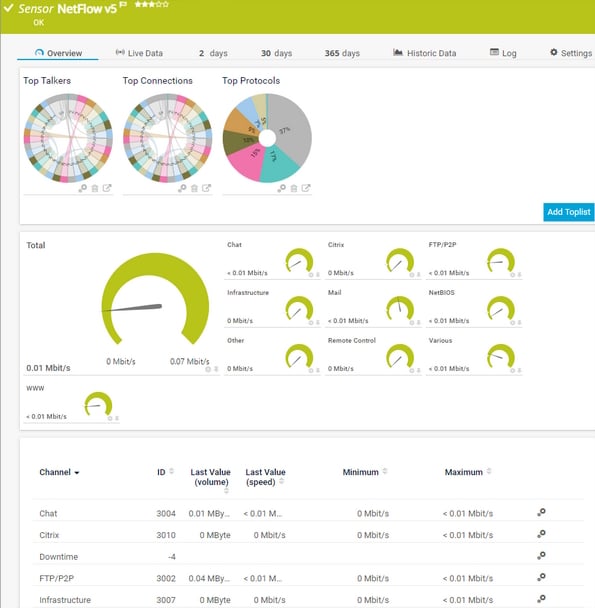
The NetFlow v5 sensor receives traffic data from a NetFlow v5-compatible device and shows the traffic by type. This sensor has several filter options to divide traffic into different channels. It can show the following and more:
The NetFlow v9 sensor receives traffic data from a NetFlow v9-compatible device and shows the traffic by type. This sensor has several filter options to divide traffic into different channels. It can show the following and more:
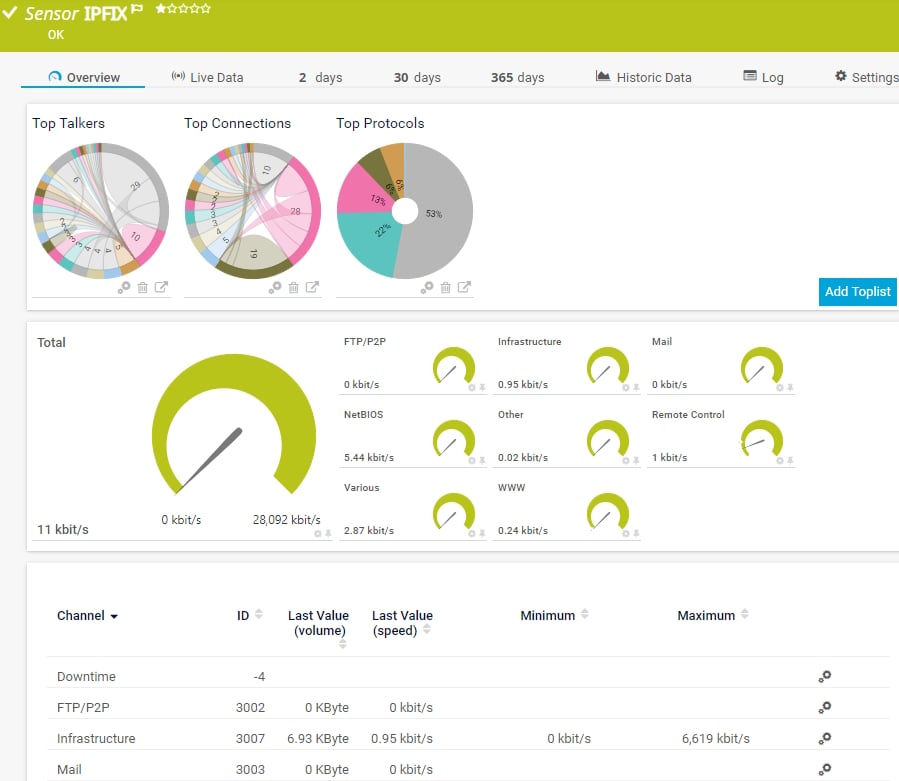
The IPFIX sensor receives traffic data from an Internet Protocol Flow Information Export (IPFIX) compatible device and shows traffic by type. It can show the following and more:
The SNMP Traffic v2 sensor monitors bandwidth and traffic on a device. It can show the following:
See the PRTG Manual for a list of all available sensor types.

Custom alerts and data visualization make it easy to monitor, identify, and prevent bandwidth and other performance issues.
PRTG is set up in a matter of minutes and can be used on a wide variety of mobile devices.

Partnering with innovative IT vendors, Paessler unleashes synergies to create
new and additional benefits for joined customers.
Combining their tools to a powerful solution for advanced analysis and automation, KnowledgeRiver and Paessler enable IT teams to ensure best performance for their infrastructure and networks.
Asset visibility is a big problem for many IT teams. Not having an accurate inventory of tech assets is inefficient, costly and a potential security risk.
Combining PRTG’s broad monitoring feature set with IP Fabric’s automated network assurance creates a new level of network visibility and reliability.
Custom alerts and data visualization make it easy to monitor, identify, and prevent bandwidth and other performance issues.
Network Monitoring Software – Version 25.3.110.1313 (August 27, 2025)
Download for Windows and cloud-based version PRTG Hosted Monitor available
English, German, Spanish, French, Portuguese, Dutch, Russian, Japanese, and Simplified Chinese
Network devices, bandwidth, servers, applications, virtual environments, remote systems, IoT, and more
Choose the PRTG Network Monitor subscription that's best for you
NetFlow is a network protocol developed by Cisco Systems that collects and monitors network traffic flow data. It can be used to obtain insights into network traffic flow patterns, bandwidth performance, network usage, performance, network security, and more.
A NetFlow traffic collector collects and saves NetFlow data sent by Cisco devices and makes it available to a NetFlow traffic analyzer for network traffic analysis.
A NetFlow traffic analyzer records the flow of network traffic sent by NetFlow traffic collectors and allows the analysis of bandwidth usage to identify traffic patterns, top talkers (sources of bandwidth usage), bottlenecks, and more in a network.
PRTG functions as both a NetFlow traffic collector and NetFlow traffic analyzer. Using dedicated NetFlow sensors, it monitors NetFlow data sent by network devices to establish which IP addresses, protocols or applications are causing traffic. It also measures how much data is traveling through the network between the source and endpoints. PRTG breaks down network traffic into the top talkers, top connections and top protocols that are using your network bandwidth
PRTG provides out-of-the-box sensors for NetFlow v5, NetFlow v9, and IPFIX.
In PRTG, “sensors” are the basic monitoring elements. One sensor usually monitors one measured value in your network, for example the traffic of a switch port, the CPU load of a server, or the free space on a disk drive. On average, you need about 5-10 sensors per device or one sensor per switch port.
Paessler conducted trials in over 600 IT departments worldwide to tune its network monitoring software closer to the needs of sysadmins. The result of the survey: over 95% of the participants would recommend PRTG – or already have.

Paessler PRTG is used by companies of all sizes. Sysadmins love PRTG because it makes their job a whole lot easier.
Bandwidth, servers, virtual environments, websites, VoIP services – PRTG keeps an eye on your entire network.
Everyone has different monitoring needs. That’s why we let you try PRTG for free.