• Company
    • About Us
    • Case Studies
    • Press Center
    • Events
    • Careers
    • Blog
    • Contact us
  • Contact us
  • Login
 
  • English
    • Deutsch
    • Español
    • Français
    • Italiano
    • Português
Paessler
                    - The Monitoring Experts
  • Products
    • Paessler PRTG
      Paessler PRTGMonitor your whole IT infrastructure
      • PRTG Network Monitor
      • PRTG Enterprise Monitor
      • PRTG Hosted Monitor
      • PRTG extensionsExtensions for Paessler PRTGExtend your monitoring to a new level
    • Icon Features
      FeaturesExplore all monitoring features
      • Maps & dashboards
      • Alerts & notifications
      • Multiple user interfaces
      • Distributed monitoring
      • Customizable reporting
  • Solutions
    • Industries
      IndustriesMonitor various industry sectors
      • Industrial
      • Healthcare
      • Data Center
      • Education
      • Finance
      • Government
    • IT Topics
      IT TopicsMonitor all areas of IT
      • Network Monitoring
      • Bandwidth Monitoring
      • SNMP Monitor
      • Network Mapping
      • WiFi Monitoring
      • Server Monitoring
  • Pricing
  • Resources
    • Getting Started
      Getting StartedModules for self-paced learning
    • How-to Guides
      How-to GuidesGet the most out of PRTG
    • Videos & Webinars
      Videos & WebinarsLearn from Paessler experts
    • IT  Knowledge
      IT KnowledgeExpand your IT knowledge
    • PRTG Manual
      PRTG ManualFull documentation
    • Knowledge Base
      Knowledge BaseShare community knowledge
    • PRTG Sensor Hub
      PRTG Sensor HubGet sensors, scripts & templates
    • Trainings
      PRTG TrainingLearn how to work with PRTG
  • Partners
    • icon star
      New Partners and MSPBecome a new partner or MSP
    • icon partner
      Partner PortalLog in to your partner account
    • Deal Registration
      Deal RegistrationRegister your sales opportunities
    • icon search
      Find a PartnerFind partners selling Paessler products
    • icon technology
      Technology AlliancesSee Paessler technology partnerships
  • Company
    • About Us
    • Case Studies
    • Press Center
    • Events
    • Careers
    • Blog
    • Contact us
  • Contact us
  • Login
  • English
    • Deutsch
    • Español
    • Français
    • Italiano
    • Português
  • Get a quote
  • Free trial
  1. Home>
  2. IT Topics>
  3. Network>
  4. Network Scanning
PRTG Logo

Network Scanning with PRTG

Home in on network security and performance issues, fast 

  • Monitor all your network's key metrics from one place
  • Customize your monitoring environment to suit
  • Set up in minutes and get automatically alerted in case of issues
Free download
product overview

Our users give top ratings for monitoring with Paessler PRTG

Gartner peer insights
spiceworks
G2
Capterra

PRTG network scanning: What you will find on this page

Table of content
  • Keep your network running smoothly, and hackers at bay
  • Why Paessler PRTG
  • What network scanning looks like in PRTG
  • What metrics can PRTG’s network scanner keep an eye on?
  • PRTG network scanning tools: FAQ

PRTG makes scanning your network easy

Custom alerts and data visualizations make it easy to monitor, identify, and prevent bottlenecks, unplanned downtime, service interruptions, suspicious activity, and other network performance and security issues.

Free download
PRODUCT OVERVIEW

Keep your network running smoothly, and hackers at bay

Can you ever be 100% sure you're using network resources as efficiently as possible, and that there are no potential vulnerabilities bad actors could exploit?

No.

But with PRTG’s network scanning tools, you can have the next best thing: a constant eagle eye on every single metric that might impact your network’s performance, health and security.

And when we say constant, we mean 24 hours a day, seven days a week, 365 days a year (well, or 366, if it’s a leap year).

Packed with advanced features, and designed to be user-friendly and intuitive by default, PRTG’s sophisticated sensors track all your network devices’ critical metrics and alert you if something doesn’t look quite right, saving you time, effort, and giving you the peace of mind that you’ll always know about any issues before they cause disruption and unplanned downtime.

Table of content

A network administrator’s best friend: Why Paessler PRTG

Icon maps

Comprehensive monitoring functionality

A complete view of your network’s health and security at a glance. Stop wasting time and effort switching between different monitoring environments and get the visibility you need to maximize performance and plan ahead with confidence.

Icon Protection

Proactive protection

Nip potential problems in the bud, and strengthen your organization’s cybersecurity. Once you pick your preferred thresholds, PRTG monitors everything round the clock, and built-in automations alert you if there are issues, so you can step in and fix them straight away.

Icon Settings

Effortless customization

Tailor your monitoring environment to your exact needs. Create your own library of toplists and topology maps, bespoke charts, graphs, and dashboards, and reporting templates, and configure user-defined thresholds. You can even create custom monitoring sensors.

Icon Smile

As user-friendly as it gets

Enter your chosen IP range, and Auto Discovery detects your network devices, assigns the right sensors, and starts monitoring. Job done. You don’t even have to customize or configure (unless you want to). One of PRTG’s key features is that it works right out of the box.

What network scanning looks like in PRTG

Diagnose network issues by continuously monitoring applications, routers, switches, servers, firewalls, cloud services, virtual machines, VoIP, and other network hardware and software. Show bandwidth, memory, traffic, latency, and other key stats in real time and visualize data in graphic maps & dashboards to identify problems more easily. Gain the visibility you need to troubleshoot bottlenecks, service interruptions, suspicious activity, and other network performance and security issues.

PRTG Screenshot device tree view

Device tree view of the complete monitoring setup

PRTG screenshot map entire it infrastructure

Custom PRTG dashboard for keeping an eye on the entire IT infrastructure

PRTG screenshot graph live data traffic

Live traffic data graph in PRTG

Screenshot Tree Map View

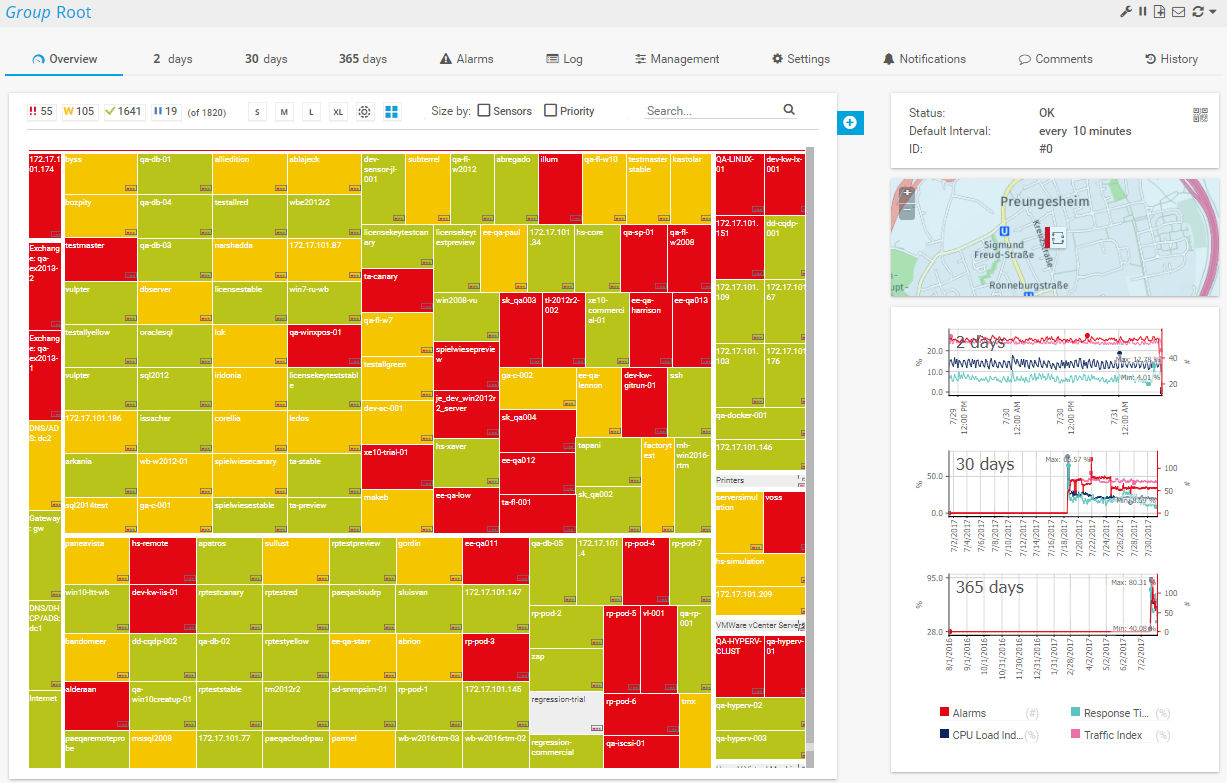
Tree map view with PRTG

Screenshot Map Network Topology

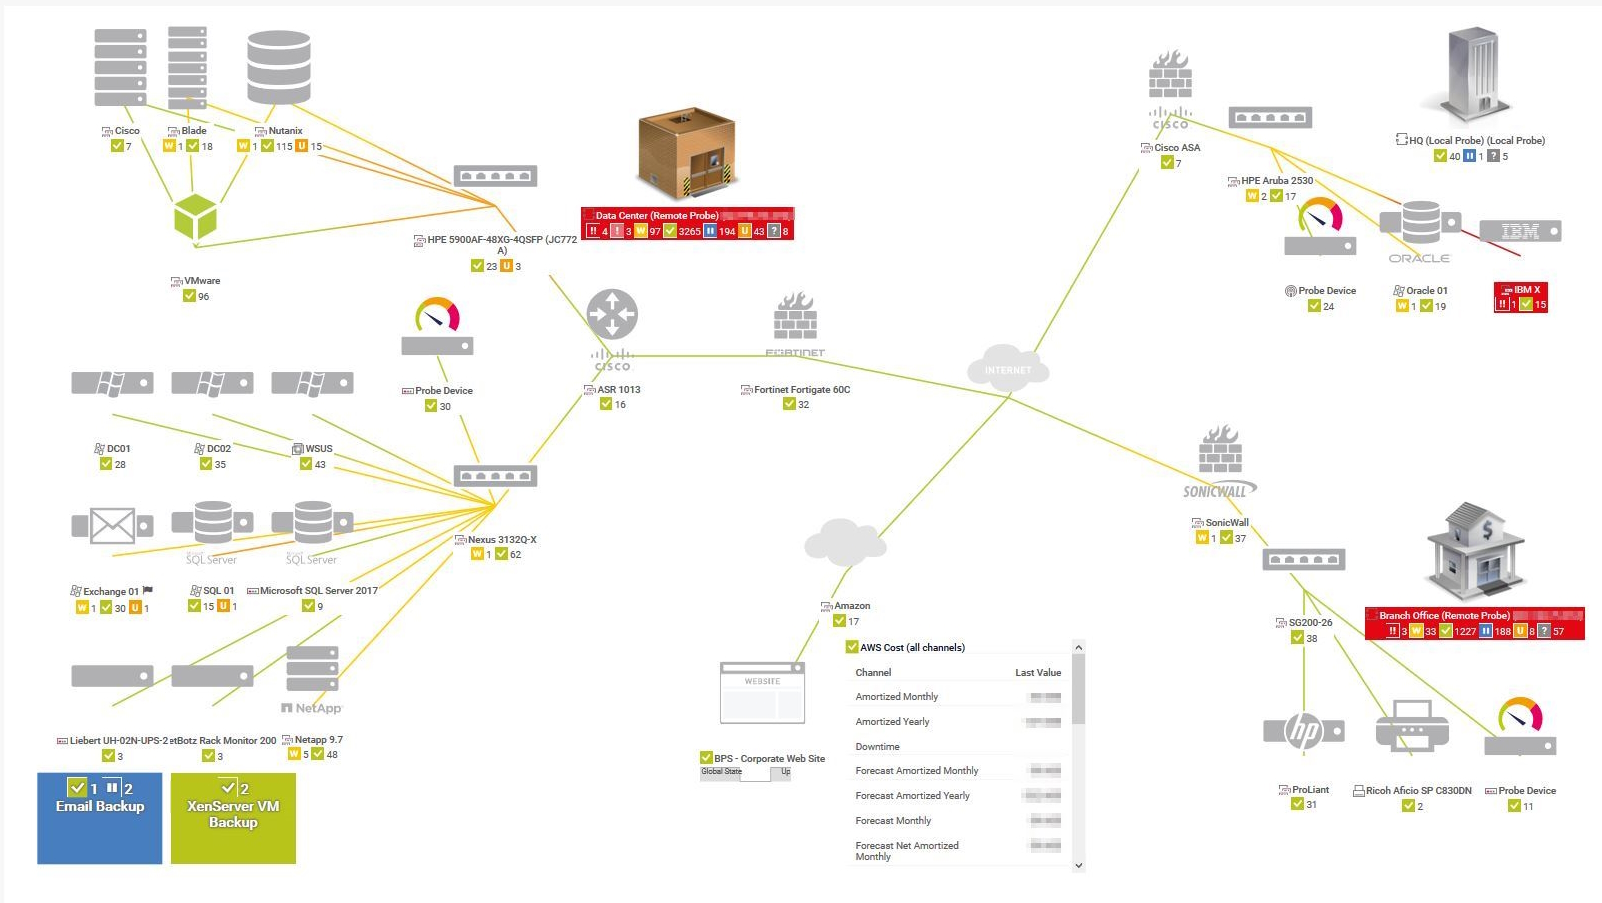
Map network topology with PRTG

Start scanning your network with PRTG and see how it can make your network more reliable and your job easier

Free download
PRODUCT OVERVIEW

IT experts agree: Paessler PRTG is a great solution for IT infrastructure monitoring

PCMag

“All-around winning
 network monitor”

IT Brief

“The real beauty of PRTG is the endless possibilities it offers”

ITPro

“PRTG Network Monitor 
is very hard to beat”

What metrics can PRTG’s network scanner keep an eye on?

Put simply, any metric imaginable. DNS. Firewalls. Operating systems. Port scanning. Routers and switches... you get the idea.


With 250 + preconfigured sensors plus the ability to create your own, and support for all major protocols —  including WMI, SNMP, and packet-sniffing, and as well as flow technologies: NetFlow, IPFIX, jFlow, and sFlow — gives you a complete picture of your network, streamlining and taking the effort out of monitoring, troubleshooting, and vulnerability scanning and vulnerability assessments.

PRTG’s network scanning sensors include:

  • Database-monitoring sensors, including for Microsoft SQL and MySQL
  • LAN-monitoring sensors
  • Network usage-monitoring sensors
  • Ping, which monitors availability and response times
  • Port scanner sensors, including sensors for monitoring TCP and UDP port status, bandwidth usage, potential vulnerabilities like open ports, and other key stats
  • Server-monitoring sensors
  • SNMP traffic, which monitors bandwidth use and data flows — useful for more efficient network management and security auditing
  • SNMP and Windows CPU load
  • Website-monitoring sensors

Explore our preconfigured PRTG sensors for Network Scanning

PRTG comes with more than 250 native sensor types for monitoring your entire on-premises, cloud, and hybrid cloud environment out of the box. Check out some examples below!

Ping v2

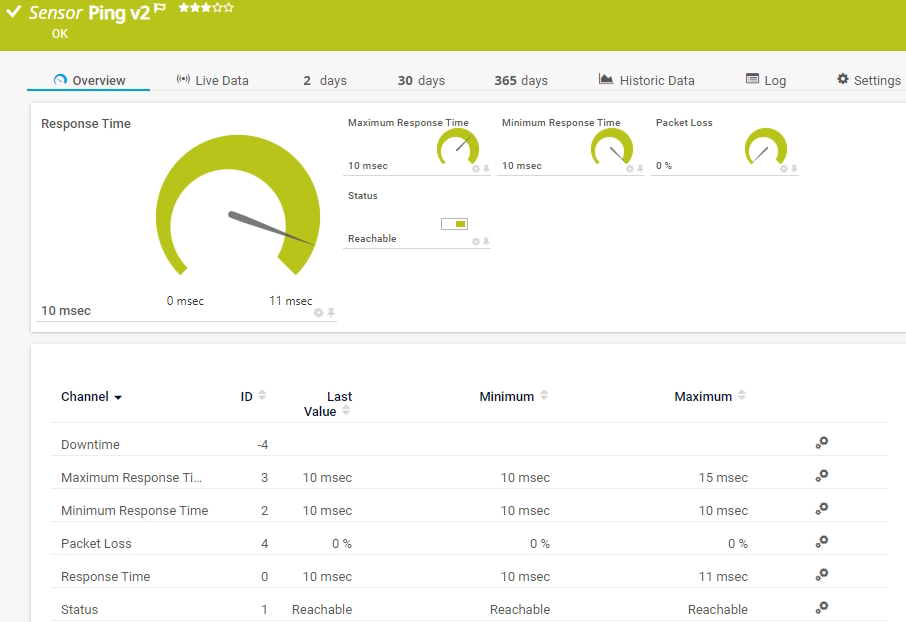
The Ping v2 sensor sends an Internet Control Message Protocol (ICMP) echo request ("ping") from the probe system to the parent device to monitor its availability. It can show the following:

• Response time

• Packet loss

• Target status

• Minimum and maximum ping time

Ping v2
Ping v2

WMI Remote Ping

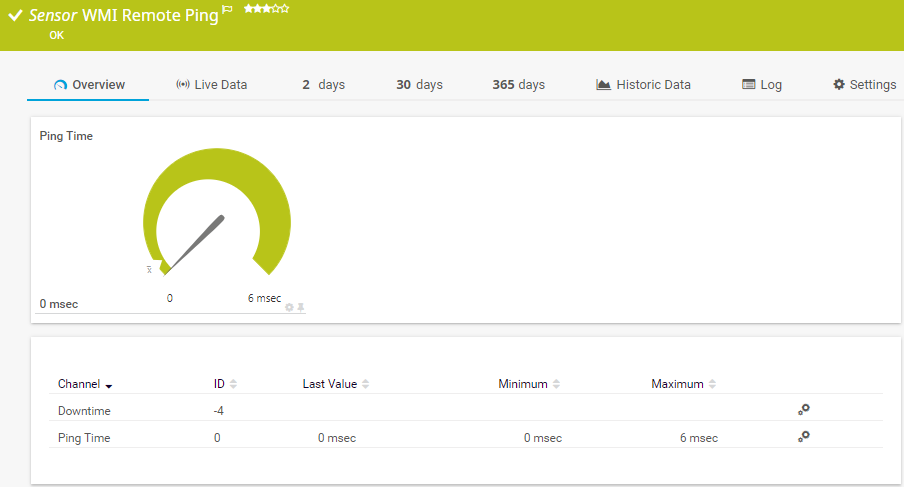
The WMI Remote Ping sensor remotely connects to a Windows system and performs an Internet Control Message Protocol (ICMP) echo request ("ping") from this device to a specified target. It can show the following:

  • Ping time from the remote device to the target device
  • Downtime
WMI Remote Ping
WMI Remote Ping

Probe Health

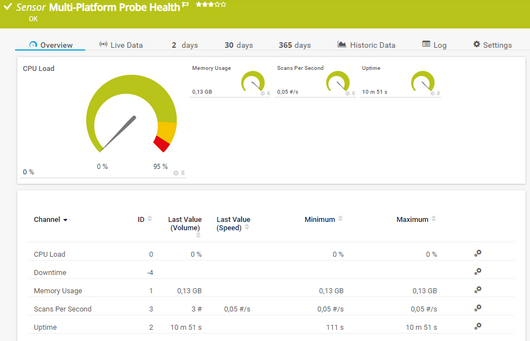
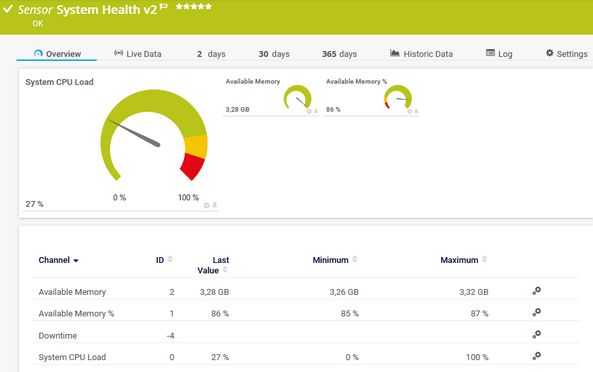
The Probe Health sensor monitors the status of the probe system. It can show the following and more:

  • Free disk space
  • Probe health as sum of the probe status
  • Interval delay for SNMP, WMI, and other sensors
  • Number of lost flow packets, buffered SNMP traps, and dropped syslog packages
  • CPU load and memory usage
Probe Health
Probe Health

System Health v2

  • The System Health v2 sensor monitors the health of a Linux system that the PRTG core server runs on. It can show the following:
  • Available memory
  • CPU load
System Health v2
System Health v2

See the PRTG Manual for a list of all available sensor types.

PRTG is compatible with all major vendors, products, and systems

compatible with all major vendors, products, and systems

Easily find the source of the problem with our PRTG network scanning solution

Real-time alerts and custom notifications make it easy to solve issues such as bottlenecks, unplanned downtime, service interruptions, suspicious activity, and other network performance and security issues.

Free download
PRODUCT OVERVIEW

”Adopting PRTG has been like going from being in the dark to being in the light. Before, we had limited visibility into what was happening in the infrastructure and in the network. Now, however, thanks to the comprehensive dashboard and real-time notifications, we receive constant updates on the status of facilities and services, and our way of working has gone from passive to proactive.”

Luca Meneghesso, Senior IT infrastructure and Security Specialist
Banca Profilo

”GESAC increasingly focuses on innovation to improve the quality of services offered and the experience of passengers handled every day by Naples Airport. Thanks to PRTG, we finally have unified, automatic, and continuous monitoring of the airport network and can guarantee quick and timely interventions.”

Domenico Ciervo, GESAC ICT Manager
Naples International Airport

”As an international company, PRTG is ideal for us. If something went down half way across the world, we wouldn’t be woken up – we can rely on PRTG to identify the problem and alert us before it occurs – enabling the right person, in the right time zone to resolve the problem. At the end of the day, if we’re to provide an internal network experience for our employees that meets expectations, we need a tool like PRTG to be successful.”

Barry Kelly, Systems Engineer
Skyscanner

“I would recommend PRTG because it has helped us significantly improve service uptime by highlighting important alerts that would otherwise result in a system failure or service disruption if action was not taken. Thanks to PRTG, we can ensure that The Ritz London’s network and IT systems are five-star, just like the hotel.”

Richard Isted, IT Manager
The Ritz London

Your network's key stats at a glance – even on the go

PRTG is set up in a matter of minutes and can be used on a wide variety of mobile devices.

device overview
Gartner peer insights

“Excellent tool for detailed monitoring. Alarms and notifications work greatly. Equipment addition is straight forward and server initial setup is very easy. ...feel safe to purchase it if you intend to monitor a large networking landscape.”

Read the complete review at Gartner Peer Insights

Create innovative solutions with Paessler’s IT partners

Partnering with innovative IT vendors, Paessler unleashes synergies to create
new and additional benefits for joined customers.

IP Fabric

IP Fabric

Combining PRTG’s broad monitoring feature set with IP Fabric’s automated network assurance creates a new level of network visibility and reliability.

Read more
Martello

Martello 

By integrating PRTG with Martello iQ, you can add a fast analytics layer to improve uptime, visualize your IT environment, and integrate all of your IT systems into a single pane of glass.

Read more
ScriptRunner

ScriptRunner

With ScriptRunner Paessler integrates a powerful event automation platform into PRTG Network Monitor.

Read more

PRTG makes scanning your network easy

Custom alerts and data visualizations make it easy to monitor, identify, and prevent bottlenecks, unplanned downtime, service interruptions, suspicious activity, and other network performance and security issues.

Free download
PRODUCT OVERVIEW
Paessler PRTG

Paessler PRTG

Network Monitoring Software – Version 25.2.106.1114 (May 05th, 2025)

Hosting icon

Hosting

Download for Windows and cloud-based version PRTG Hosted Monitor available

Languages icon

Languages

English, German, Spanish, French, Portuguese, Dutch, Russian, Japanese, and Simplified Chinese

test

Monitor everything

Network devices, bandwidth, servers, applications, virtual environments, remote systems, IoT, and more

test

Pricing

Choose the PRTG Network Monitor subscription that's best for you

Discover more monitoring insights and stories

Resources Solution

Solutions for all your monitoring needs

  • Network Device Scanner
  • Free Network Mapping Software
  • Automatically discover your network
Resources Content

Powerful stories from the monitoring world

  • The Dude Abides. But He's Not The Only Free Network Tool Out There.
  • What is SaaS? Definition and Details
  • The 5 Most Important Security Leaks to Check Your Network for Regularly
Resources Solutions

Resources to master your monitoring challenges

  • Version reporting
  • Factory Sensor Scan Interval
  • Modifying the Live Graphs Accuracy

Network Scanning: FAQ


What is PRTG network scanning?

PRTG is a proprietary monitoring solution that tracks the health and performance of your entire network, ensuring it’s always available and as stable, reliable, and secure as possible. Available for Windows-based on-premises servers or as a cloud-hosted solution, it's capable of monitoring unlimited local, remote, and virtual network devices, bringing critical system data together in one simple, intuitive interface you can access from anywhere: at the office, at home, or on the go.

My organization's network runs on Linux. Can I still use PRTG?

Yes, you most definitely can. PRTG has preconfigured sensors for Windows, Linux, and UNIX-based systems. You can only install a PRTG core server or probe on Windows. But our desktop app's interface makes connecting to it via Linux quick and easy. Check the system requirements, download the app, and follow the simple prompts to set things up. Alternatively, try our fully Linux-compatible hosted solution.

Cloud-hosted vs on-premises deployment: What’s the difference?

Both our cloud-hosted and on-premises solutions use a subscription model, which means you pay a fixed monthly or annual fee, with one key difference.

Because Network Monitor — our on-premises solution — is installed locally, your cost is fixed: you pay the same price during the whole subscription period.

Our cloud-based solution PRTG Hosted Monitor, on the other hand, gives you the flexibility to upgrade or downgrade at any point during your subscription period. Should you upgrade or downgrade, the price of your subscription will go up or down accordingly.

How do I set up PRTG?

Quickly and easily. Download PRTG, log in and enter your network credentials, and pick an IP address range. Auto-Discovery’s advanced IP scanner will detect every network device within that range and assign the appropriate sensors. Job done. Then you can either sit back and let PRTG do its thing, or tweak your monitoring environment so it's just the way you want it.

What is a sensor in PRTG?

In PRTG, “sensors” are the basic monitoring elements. One sensor usually monitors one measured value in your network, for example the traffic of a switch port, the CPU load of a server, or the free space on a disk drive. On average, you need about 5-10 sensors per device or one sensor per switch port.

We asked: would you recommend PRTG? Over 95% of our customers say yes!

Paessler conducted trials in over 600 IT departments worldwide to tune its network monitoring software closer to the needs of sysadmins. The result of the survey: over 95% of the participants would recommend PRTG – or already have.

recommendation

Still not convinced?

Love

More than 500,000 sysadmins love PRTG

Paessler PRTG is used by companies of all sizes. Sysadmins love PRTG because it makes their job a whole lot easier.

PRTG

Monitor your entire IT infrastructure

Bandwidth, servers, virtual environments, websites, VoIP services – PRTG keeps an eye on your entire network.

test

Try Paessler PRTG for free

Everyone has different monitoring needs. That’s why we let you try PRTG for free.

PRTG Logo

Start scanning your network with PRTG and see how it can make your network more reliable and your job easier

Free download
PRODUCT OVERVIEW

Products

  • Paessler PRTG
    Paessler PRTGMonitor your whole IT infrastructure
    • PRTG Network Monitor
    • PRTG Enterprise Monitor
    • PRTG Hosted Monitor
    • PRTG extensions
      Extensions for Paessler PRTGExtend your monitoring to a new level
  • Icon Features
    FeaturesExplore all monitoring features

Monitoring with PRTG

  • Network monitoring
  • Bandwidth monitoring
  • SNMP monitoring
  • Network mapping
  • Wi-Fi monitoring
  • Server monitoring
  • Network traffic analyzer
  • NetFlow monitoring
  • Syslog server

Useful Links

  • PRTG Manual
  • Knowledge Base
  • Customer Success Stories
  • About Paessler
  • Subscribe to newsletter
  • PRTG Support
  • PRTG Consulting

Contact

Paessler GmbH
Thurn-und-Taxis-Str. 14, 
90411 Nuremberg 
Germany

info@paessler.com

+49 911 93775-0

  • Contact us
©2025 Paessler GmbHTerms & ConditionsPrivacy PolicyImprintReport VulnerabilityDownload & InstallSitemap
404 - Page not found 404 - Page not found 404 - Page not found