Custom alerts and data visualization let you quickly identify and prevent issues with database operations.
For system admins, troubleshooting large databases can seem never-ending. On Linux and macOS systems, database management is often synonymous with PostgreSQL database systems. These preconfigured systems often fail to meet the specific requirements of an organization’s IT infrastructure. This is where Paessler PRTG PostgreSQL performance monitoring shines.
Diagnose network issues by continuously tracking the availability, health, and performance of your PostgreSQL database systems. Show latency, workloads, the number of running queries and affected rows, and other performance metrics in real time. Visualize monitoring data in clear graphs and dashboards to identify problems more easily. Gain the overview you need to troubleshoot slow queries and other PostgreSQL database errors.

Device tree view of the complete monitoring setup

Custom PRTG dashboard for keeping an eye on the entire IT infrastructure

Live traffic data graph in PRTG
“All-around winning
network monitor”
“The real beauty of PRTG is the endless possibilities it offers”
“PRTG Network Monitor
is very hard to beat”
PRTG comes with more than 250 native sensor types for monitoring your entire on-premises, cloud, and hybrid cloud environment out of the box. Check out some examples below!
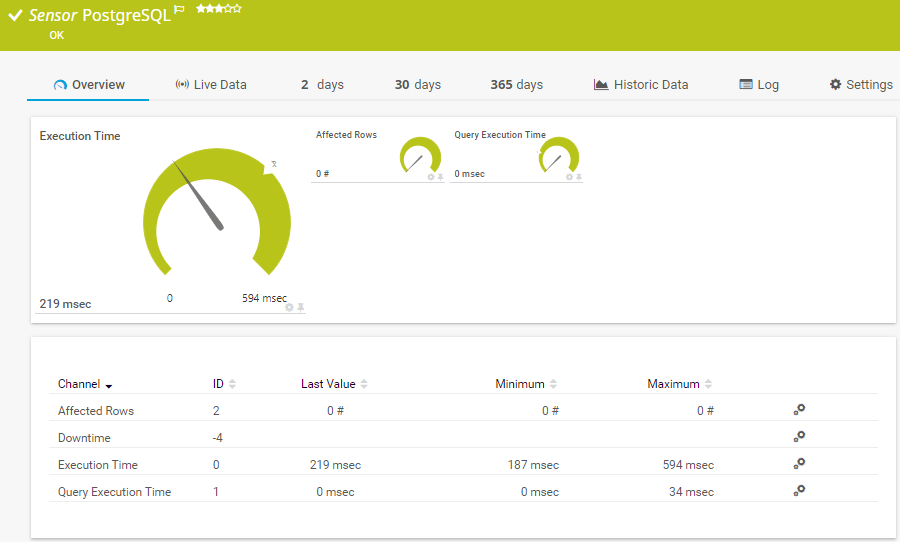
The PostgreSQL sensor monitors a database on a PostgreSQL server and executes a query. It can show the following:
The ADO SQL v2 sensor monitors a database via an ActiveX Data Objects (ADO) connection and it executes an SQL query. It can show the following:
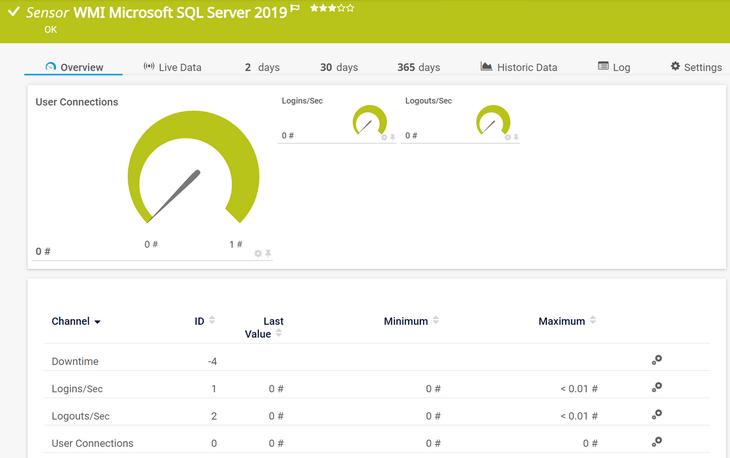
The WMI Microsoft SQL Server 2019 sensor monitors the performance of a Microsoft SQL Server. It can show the following and more:
See the PRTG Manual for a list of all available sensor types.

Custom alerts and data visualization let you quickly identify and prevent issues with database operations.
Set up PRTG in minutes and use it on almost any mobile device.


“Excellent tool for detailed monitoring. Alarms and notifications work greatly. Equipment addition is straight forward and server initial setup is very easy. ...feel safe to purchase it if you intend to monitor a large networking landscape.”
Partnering with innovative IT vendors, Paessler unleashes synergies to create
new and additional benefits for joined customers.
IT that works constitutes a business-critical basis for a company's success. Availability and security must be defined for the respective purpose and closely monitored – by OT and IT alike.
Integrating monitoring results from PRTG into NetBrain maps makes the foundation for network automation.
With ScriptRunner Paessler integrates a powerful event automation platform into PRTG Network Monitor.
Real-time notifications mean faster troubleshooting so that you can act before more serious issues occur.
Network Monitoring Software – Version 25.3.110.1313 (August 27, 2025)
Download for Windows and cloud-based version PRTG Hosted Monitor available
English, German, Spanish, French, Portuguese, Dutch, Russian, Japanese, and Simplified Chinese
Network devices, bandwidth, servers, applications, virtual environments, remote systems, IoT, and more
Choose the PRTG Network Monitor subscription that's best for you

PostgreSQL is an open-source, powerful, and feature-rich relational database management system (RDBMS) that supports both SQL (relational) and JSON (non-relational) querying. It is widely known for its robustness, extensibility, and compliance with the ACID properties (Atomicity, Consistency, Isolation, Durability), ensuring transactional integrity.
Monitoring your PostgreSQL databases is a crucial part of systems administration. Monitoring provides the data you need to identify performance issues, ensure high availability, reduce downtimes to a minimum, and optimize resource usage.
When properly configured, monitoring has a low impact on performance. For ease of management, PRTG provides the performance impact of each sensor, so you can make more informed decisions.
Yes. To install and use the PostgreSQL sensor, you’ll need to meet the following requirements:
PRTG does PostgreSQL monitoring really well, but it does all-in-one monitoring even better. PRTG is an all-in-one monitoring solution with customizable dashboards, alerts, and extensive sensor support.
No. In addition to PostgreSQL, PRTG comes with various sensors that are useful for detecting database problems. You can use our software to monitor all the most popular SQL databases, including:
If you need extended database monitoring for databases such as IBM DB2, SAP HANA, SAP MaxDB, and others, check out our brand-new product extension PRTG Database Observer.
In PRTG, “sensors” are the basic monitoring elements. One sensor usually monitors one measured value in your network, for example the traffic of a switch port, the CPU load of a server, or the free space on a disk drive. On average, you need about 5-10 sensors per device or one sensor per switch port.
Paessler conducted trials in over 600 IT departments worldwide to tune its network monitoring software closer to the needs of sysadmins. The result of the survey: over 95% of the participants would recommend PRTG – or already have.

Paessler PRTG is used by companies of all sizes. Sysadmins love PRTG because it makes their job a whole lot easier.
Bandwidth, servers, virtual environments, websites, VoIP services – PRTG keeps an eye on your entire network.
Everyone has different monitoring needs. That’s why we let you try PRTG for free.