Custom alerts and data visualization let you quickly identify and prevent all kinds of network issues.
Do you spend too much time integrating multiple tools just to monitor your network? Many IT professionals face this challenge. Setting up data collectors before visualizing metrics unnecessarily complicates your workflow. Paessler PRTG offers a practical Grafana alternative by providing a unified monitoring solution that eliminates the need to assemble and maintain multiple specialized tools.
Comprehensive network monitoring should cover your entire IT infrastructure, including servers, applications, networks, and cloud services. Although Grafana offers visualization and monitoring capabilities, complete coverage requires separate data collection systems, such as Prometheus, InfluxDB, or other time-series databases. This fragmented approach often leads to increased complexity and maintenance costs.
The all-in-one platform from Paessler eliminates the headaches of integration. You won't need to become an expert at connecting disparate systems or maintaining multiple tools. Instead, you can focus on what matters most: keeping your infrastructure running smoothly. The platform includes over 250 preconfigured sensor types that work right out of the box, allowing you to quickly monitor critical systems without extensive configuration.
Paessler provides immediate value with its ready-to-use monitoring platform, which consolidates the functions of multiple specialized tools. Its intuitive interface presents complex monitoring data in user-friendly dashboards, enabling technical and non-technical team members equally to swiftly interpret system status.
The comprehensive monitoring approach goes beyond basic infrastructure checks, incorporating detailed performance metrics, capacity planning insights, and trend analysis. PRTG identifies potential bottlenecks before they become critical issues by analyzing data from different systems and services.
Quick installation with automatic network discovery and smart setup for instant monitoring
Custom dashboard creation via drag & drop with easy-to-read visualized overviews
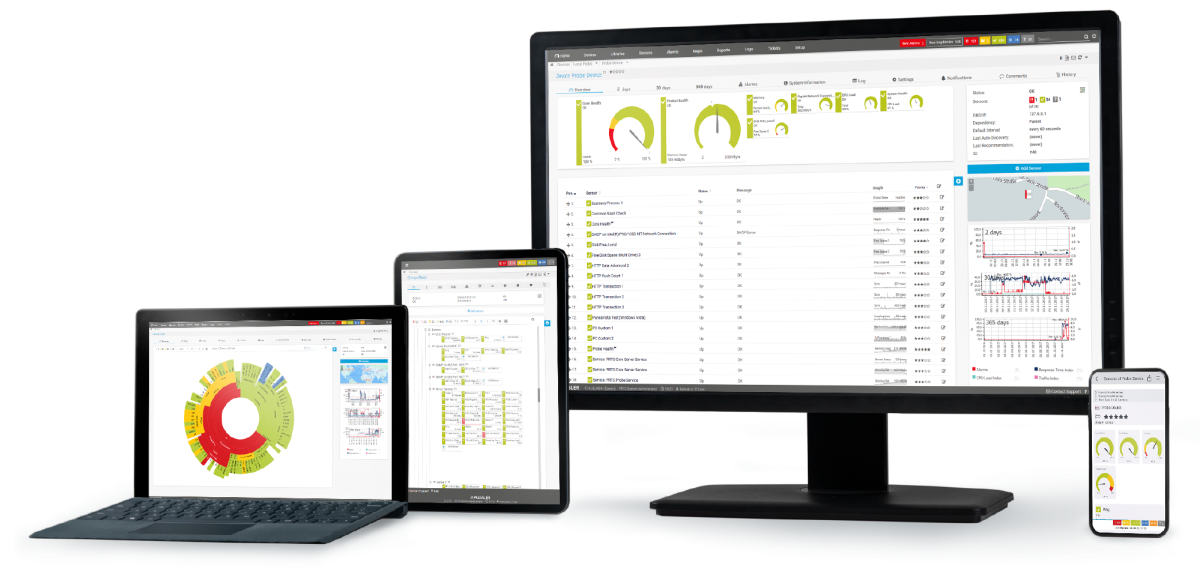
Different user interfaces for web, desktop, and mobile apps for monitoring on the go
Network of qualified implementation partners to support you with a smooth migration to PRTG
Diagnose network issues by continuously tracking the health, availability, and performance of your entire IT infrastructure. Show hardware parameters, application performance, network traffic, bandwidth usage, and other key metrics in real time. Visualize data in clear graphs and dashboards to identify problems more easily. Gain the overview you need to troubleshoot all kinds of issues in your network.

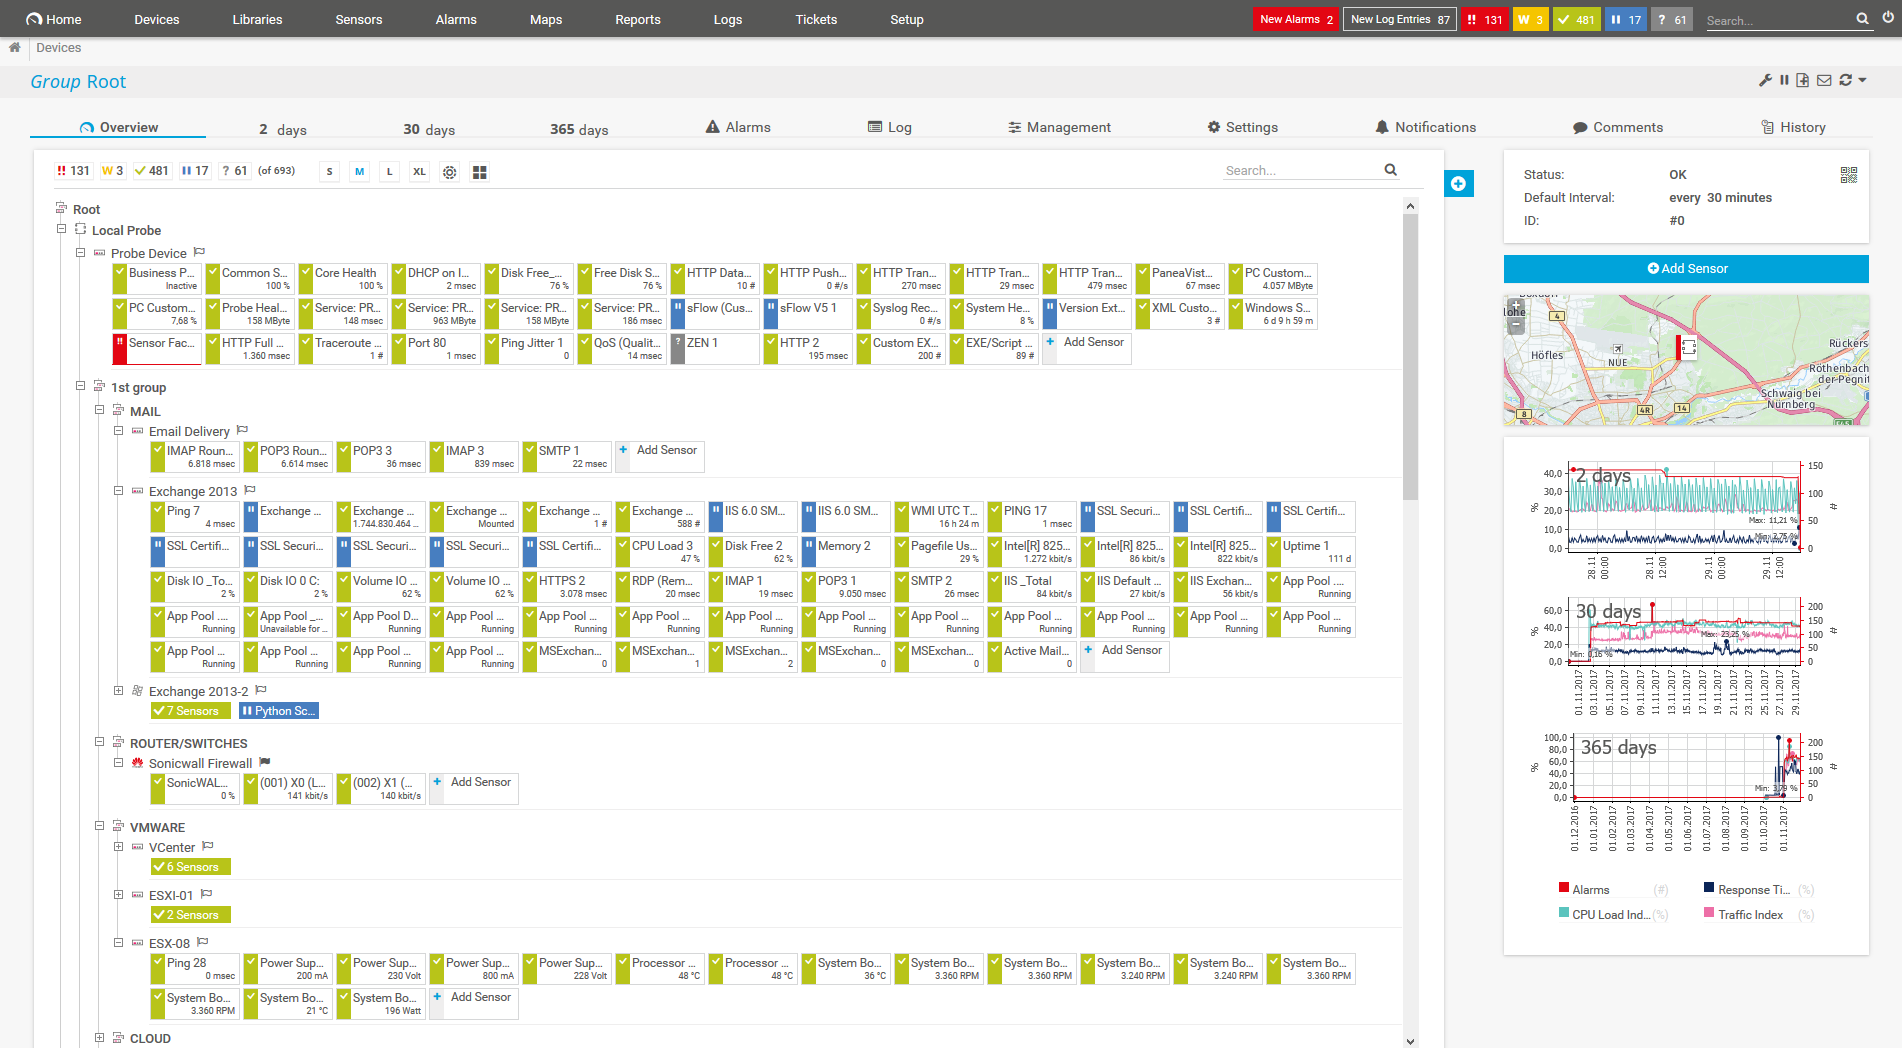
Device tree view of the complete monitoring setup

Custom PRTG dashboard for keeping an eye on the entire IT infrastructure

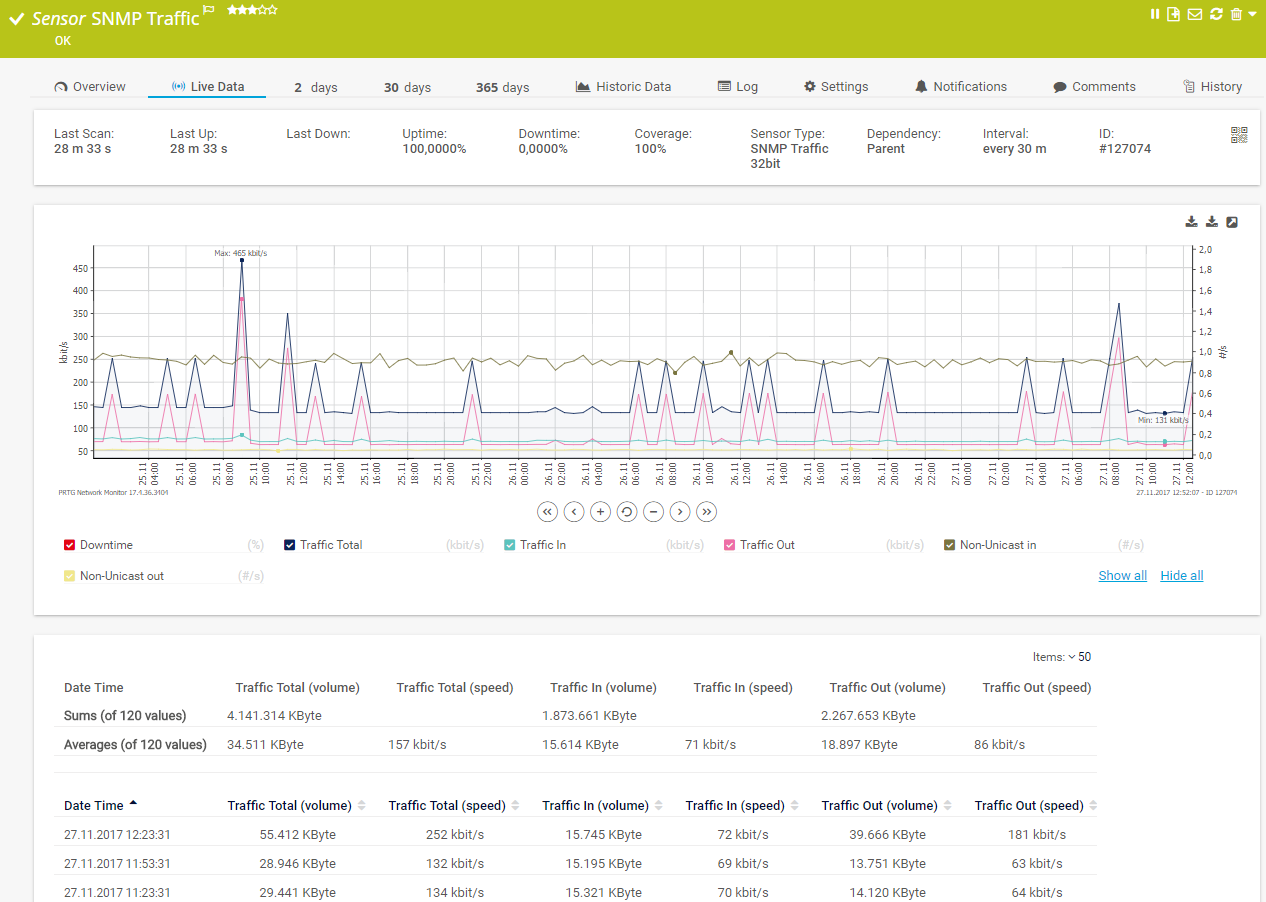
Live traffic data graph in PRTG
FEATURE | PRTG PRTG | Grafana Grafana |
|---|---|---|
One tool for your entire network | PRTG All monitoring features included | Grafana Primarily a visualization tool, separate data collection required |
Easy setup, intuitive monitoring | PRTG User-friendly interfaces for web, desktop, and mobile | Grafana Requires technical expertise to set up data sources |
Automatic network discovery | PRTG Included | Grafana Not available; requires third-party tools for discovery |
Real-time alerts & notifications | PRTG Advanced, highly customizable alerting via different notification methods | Grafana Basic alerting capabilities dependent on data source plugins |
Custom maps & dashboards | PRTG Custom dashboard creation via drag & drop | Grafana Individual visualization capabilities with extensive customization options |
Agentless monitoring | PRTG No need to install agents on the monitored systems | Grafana Depends on the data collection tools you integrate |
On-premises or cloud-based | PRTG Flexible deployment options available | Grafana Requires separate data collection infrastructure |
Enterprise version | PRTG Available | Grafana Available, but not for monitoring purposes |
Freeware version | PRTG Available for up to 100 sensors, free for life | Grafana Open-source core available for free |
Distributed network monitoring | PRTG Monitoring an unlimited number of remote locations included | Grafana Requires additional configuration and tools |
Server & application monitoring | PRTG Out-of-the-box integration, no extra cost | Grafana Requires integration with third-party data sources |
Network performance monitoring | PRTG Out-of-the-box integration, no extra cost | Grafana Requires integration with specialized network monitoring tools |
Bandwidth monitoring | PRTG Out-of-the-box integration, no extra cost | Grafana Requires integration with flow collectors or similar tools |
Network traffic analyzer | PRTG Out-of-the-box integration, no extra costs | Grafana Requires separate traffic analysis tools |
Cloud services monitoring | PRTG Out-of-the-box integration, no extra cost | Grafana Requires cloud-specific data collectors |
Virtual infrastructure monitoring | PRTG Out-of-the-box integration, no extra cost | Grafana Requires integration with VM monitoring tools |
Storage resource monitoring | PRTG Out-of-the-box integration, no extra cost | Grafana Requires integration with storage monitoring solutions |
Database monitoring | PRTG Out-of-the-box integration, no extra cost | Grafana Requires database-specific data collectors |
Web performance monitoring | PRTG Out-of-the-box integration, no extra cost | Grafana Requires integration with web monitoring tools |
Supports leading technologies | PRTG SNMP, flow protocols, packet sniffing, WMI, HTTP, ping, SQL, and much more | Grafana Requires external data collection tools |
Create your own scripts | PRTG Own PRTG API included for custom sensors and scripts | Grafana Offers plugin development but requires external data collection |
Includes technical support | PRTG Expert support included, no extra costs | Grafana Community support for open source; paid support for Enterprise version |
Modern IT environments require modern monitoring solutions that provide both comprehensive visibility and operational simplicity. You deserve to focus on solving real IT challenges rather than endlessly configuring monitoring systems.
Choose a straightforward subscription model based on the number of sensors you need, not complex calculations of data volume or users. Upgrade or downgrade your license as your monitoring requirements change without unexpected cost increases. Avoid the surprise bills that come with data-ingestion pricing models.
Access dedicated technical assistance from monitoring specialists who understand your challenges, not generic help desk agents. Receive personalized guidance for your specific monitoring setup through comprehensive documentation and responsive support. Get your questions answered quickly so you can focus on keeping your systems running smoothly.
Control your entire monitoring environment from one interface, eliminating the need to switch between multiple tools and dashboards. Standardize your monitoring approach across different technologies and locations to ensure consistent visibility. Minimize the administrative overhead of maintaining separate systems for collection, visualization, and alerting.
Detect potential issues before they impact your users with intelligent thresholds and baseline analysis. Receive notifications through multiple channels including email, SMS, and push notifications to your mobile device. Take immediate action with detailed diagnostic information that pinpoints the root cause of problems.
Custom alerts and data visualization let you quickly identify and prevent all kinds of network issues.
PRTG is set up in a matter of minutes and can be used on a wide variety of mobile devices.

We also compared PRTG with other monitoring tools:
The basic version of the open-source tool Nagios is free of charge. But most users spent many hours to set up and customize the tool. In case of problems, browsing through forums is often the only solution.
Checkmk is a comprehensive network monitoring tool, but it uses open-source add-ons for some functions. This means additional work in setting up, operating, and maintaining the monitoring systems.
Zabbix is open-source software with a strong community support. But it requires lots of manual configuration work to install and set it up. You also need to install agents on the monitored systems.
Prometheus is an open-source tool that excels at monitoring containerized applications. However, it lacks comprehensive network monitoring capabilities and requires extensive manual configuration for infrastructure visibility.
Real-time notifications mean faster troubleshooting so that you can act before more serious issues occur.
Partnering with innovative IT vendors, Paessler unleashes synergies to create
new and additional benefits for joined customers.
baramundi and PRTG create a secure, reliable and powerful IT infrastructure where you have everything under control - from the traffic in your firewall to the configuration of your clients.
IT that works constitutes a business-critical basis for a company's success. Availability and security must be defined for the respective purpose and closely monitored – by OT and IT alike.
UVexplorer integrates tightly with PRTG to bring fast and accurate network discovery, detailed device inventory, and automatic network mapping to the PRTG platform.
Network Monitoring Software – Version 25.3.110.1313 (August 27, 2025)
Download for Windows and cloud-based version PRTG Hosted Monitor available
English, German, Spanish, French, Portuguese, Dutch, Russian, Japanese, and Simplified Chinese
Network devices, bandwidth, servers, applications, virtual environments, remote systems, IoT, and more
Choose the PRTG Network Monitor subscription that's best for you
Choosing between Paessler PRTG and Grafana depends on several factors, such as your specific network monitoring needs, budget, and technical resources available in your organization.
PRTG is ideal:
Grafana might be your choice:
Paessler PRTG offers a straightforward sensor-based pricing model with predictable costs regardless of data volume for Windows, Linux, and network device monitoring. While Grafana's open-source version is free, you'll need to deploy and maintain separate data collection systems for real-time monitoring, adding hidden infrastructure costs. PRTG includes everything in one package with transparent pricing.
Grafana Labs offers highly customizable dashboards with numerous chart types and JSON customization. PRTG provides comprehensive visualization tools for network observability that work out of the box with minimal setup, making them more accessible for organizations monitoring uptime and performance while still delivering professional results.
PRTG includes robust automatic network discovery that identifies routers and network devices, suggesting appropriate sensors for real-time monitoring. Grafana has no built-in network discovery functionality for infrastructure monitoring and requires integration with additional third-party tools like Zabbix, adding complexity to your monitoring setup.
PRTG provides a comprehensive alerting system with multiple notification methods and sophisticated alert conditions directly tied to server monitoring data. While Grafana offers alerting capabilities, they depend on connected data sources like Graphite and require additional configuration. PRTG's system includes more advanced authentication and notification options out of the box.
Grafana excels at connecting to various data sources including AWS and Azure. PRTG takes a different approach by providing its own comprehensive data collection system with hundreds of pre-configured sensors for cloud observability, while still supporting integration with external systems through its API and automation capabilities.
PRTG's API allows integration with CI/CD pipelines and GitHub workflows, providing the visibility needed for service reliability and uptime monitoring. Unlike Grafana, which requires additional tools for actual monitoring, PRTG combines monitoring and visualization in one platform, simplifying the DevOps toolchain.
PRTG can complement existing Linux monitoring setups through its API and custom sensor capabilities. Unlike Grafana, which primarily serves as a visualization layer for tools like Graphite, PRTG provides both monitoring and visualization for comprehensive observability. This allows you to gradually migrate from existing tools to PRTG while reducing the need for multiple systems.
In PRTG, “sensors” are the basic monitoring elements. One sensor usually monitors one measured value in your network, for example the traffic of a switch port, the CPU load of a server, or the free space on a disk drive. On average, you need about 5-10 sensors per device or one sensor per switch port.
Paessler conducted trials in over 600 IT departments worldwide to tune its network monitoring software closer to the needs of sysadmins. The result of the survey: over 95% of the participants would recommend PRTG – or already have.
You are interested to know if PRTG could be an alternative to your Grafana implementation?