• Company
    • About Us
    • Case Studies
    • Press Center
    • Events
    • Careers
    • Blog
    • Contact us
  • Login
 
  • English
    • Deutsch
    • Español
    • Français
    • Italiano
    • Português
Paessler
                    - The Monitoring Experts
  • Products
    • Paessler PRTG
      Paessler PRTGMonitor your whole IT infrastructure
      • PRTG Network Monitor
      • PRTG Enterprise Monitor
      • PRTG Hosted Monitor
      • PRTG extensionsExtensions for Paessler PRTGExtend your monitoring to a new level
    • Icon Features
      FeaturesExplore all monitoring features
      • Maps & dashboards
      • Alerts & notifications
      • Multiple user interfaces
      • Distributed monitoring
      • Customizable reporting
  • Solutions
    • Industries
      IndustriesMonitor various industry sectors
      • Industrial
      • Healthcare
      • Data Center
      • Education
      • Finance
      • Government
    • IT Topics
      IT TopicsMonitor all areas of IT
      • Network Monitoring
      • Bandwidth Monitoring
      • SNMP Monitor
      • Network Mapping
      • WiFi Monitoring
      • Server Monitoring
  • Pricing
  • Resources
    • Getting Started
      Getting StartedModules for self-paced learning
    • How-to Guides
      How-to GuidesGet the most out of PRTG
    • Videos & Webinars
      Videos & WebinarsLearn from Paessler experts
    • IT  Knowledge
      IT KnowledgeExpand your IT knowledge
    • PRTG Manual
      PRTG ManualFull documentation
    • Knowledge Base
      Knowledge BaseShare community knowledge
    • PRTG Sensor Hub
      PRTG Sensor HubGet sensors, scripts & templates
    • Trainings
      PRTG TrainingLearn how to work with PRTG
  • Partners
    • icon star
      New Partners and MSPBecome a new partner or MSP
    • icon partner
      Partner PortalLog in to your partner account
    • icon search
      Find a PartnerFind partners selling Paessler products
    • icon technology
      Technology AlliancesSee Paessler technology partnerships
  • Company
    • About Us
    • Case Studies
    • Press Center
    • Events
    • Careers
    • Blog
    • Contact us
  • Login
  • English
    • Deutsch
    • Español
    • Français
    • Italiano
    • Português
  • Get a quote
  • Free trial
  1. Home>
  2. IT Topics>
  3. Cloud>
  4. EC2 Monitoring Tool
PRTG Logo

EC2 Monitoring with PRTG

Maximize your AWS EC2 performance and availability

  • Detect issues proactively through real-time monitoring and alerts
  • Optimize EC2 costs and performance with detailed scaling insights
  • Stay informed across all AWS metrics thanks to easy-to-use dashboards
Free download
product overview

Our users give top ratings for monitoring with Paessler PRTG

Gartner peer insights
spiceworks
Capterra
G2
Trustpilot

PRTG EC2 monitoring: What you will find on this page

Table of content
  • Do you actually have a detailed insight into your AWS EC2 infrastructure?
  • Why PRTG is the ideal fit for monitoring your Amazon EC2 environment
  • What EC2 monitoring looks like in PRTG
  • 3 reasons why PRTG is the EC2 monitoring tool of your choice
  • Preconfigured PRTG sensors for EC2 monitoring
  • EC2 Monitoring: FAQ

PRTG makes EC2 monitoring as easy as it gets

Custom alerts and data visualization let you quickly identify and prevent issues in your EC2 web service.

Free download
PRODUCT OVERVIEW

Do you actually have a detailed insight into your AWS EC2 infrastructure?

Managing an Amazon Web Services (AWS) Elastic Compute Cloud (EC2) environment can be a real challenge. Especially when it comes to maintaining comprehensive observability of your instances and ensuring that performance issues don't go unnoticed.  

Without the right EC2 monitoring tools, it’s easy for potential problems to slip through the cracks.  

Paessler PRTG steps in to fill these gaps and helps you to avoid unnecessary costs in the operation of your AWS environment and also prevents expensive downtimes. 

Table of content

Why PRTG is the ideal fit for monitoring your Amazon EC2 environment

Icon Eye

Deep visibility into EC2 performance

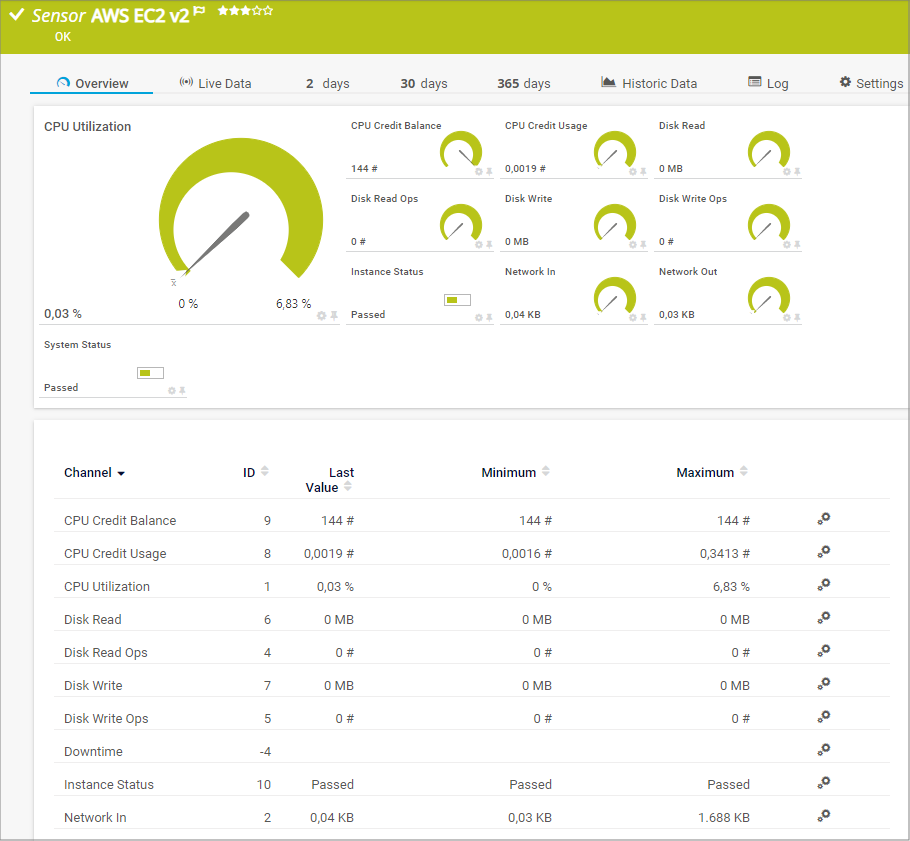
PRTG’s AWS EC2 v2 sensors continuously collect metrics via the Amazon CloudWatch API such as CPU credits, system status checks, disk I/O, memory usage, network interfaces, and bandwidth.  

This in-depth visibility allows you to identify and address any bottlenecks or underperforming instances.

Icon Alert

Customizable alerts and notifications

Adapt your PRTG monitoring setup to focus on the metrics that matter most to your operations.  

Set up customized alerts to notify you of potential issues based on your specific thresholds, ensuring you’re always in control.

Icon Cloud

Wide range of AWS sensor types

PRTG includes many different types of sensors with which you can fully monitor your AWS CloudWatch metrics.  

Whether AWS cloud costs, load balancing, your AWS Elastic Block Score or databases, PRTG is prepared for it.

icon boost

Scalable monitoring solution

Whether you’re running your Elastic Cloud as a single Amazon EC2 instance type, or a complex, multi-region deployment, PRTG scales with your needs.  

This ensures consistent monitoring and performance tracking as your cloud infrastructure grows.

What EC2 monitoring looks like in PRTG

Diagnose network issues by continuously tracking your AWS EC2 performance. Show EC2 costs, database performance, CPU usage, disk read and write operations, and other key metrics in real time. Visualize monitoring data in clear graphs and dashboards to identify problems more easily. Gain the overview you need to troubleshoot issues in your AWS EC2 infrastructure.

PRTG Screenshot device tree view

Device tree view of the complete monitoring setup

PRTG screenshot map entire it infrastructure

Custom PRTG dashboard for keeping an eye on the entire IT infrastructure

PRTG screenshot graph live data traffic

Live traffic data graph in PRTG

Start monitoring EC2 with PRTG and see how it can make your network more reliable and your job easier.

Free download
PRODUCT OVERVIEW

IT experts agree: Paessler PRTG is a great solution for IT infrastructure monitoring

PCMag

“All-around winning
 network monitor”

IT Brief

“The real beauty of PRTG is the endless possibilities it offers”

ITPro

“PRTG Network Monitor 
is very hard to beat”

3 reasons why PRTG is the EC2 monitoring tool of your choice

Icon Finance

Flexible subscription model

Our subscription-based licensing and pricing allows you to scale your monitoring needs as your Amazon Elastic Compute Cloud infrastructure grows.

This flexibility ensures that you only pay for what you need, with the option to upgrade or adjust your plan as your requirements change.

Icon Lock

Strong security measures

PRTG comes with advanced SSL/TLS encryption, strict access controls, and secure data transmission to make sure that your monitoring data remains protected. 

This secures your AWS cloud computing environment against potential security threats, and you can focus on your core business with peace of mind.

Icon Update

Continuous improvements

Regular software updates ensure that you always have access to the latest features, performance improvements, and security patches.  

When you choose PRTG, you invest in a secure and flexible monitoring solution that adapts to your AWS EC2 needs.

Explore our preconfigured PRTG sensors for EC2 monitoring

PRTG comes with more than 250 native sensor types for monitoring your entire on-premises, cloud, and hybrid cloud environment out of the box. Check out some examples below!

AWS Cost

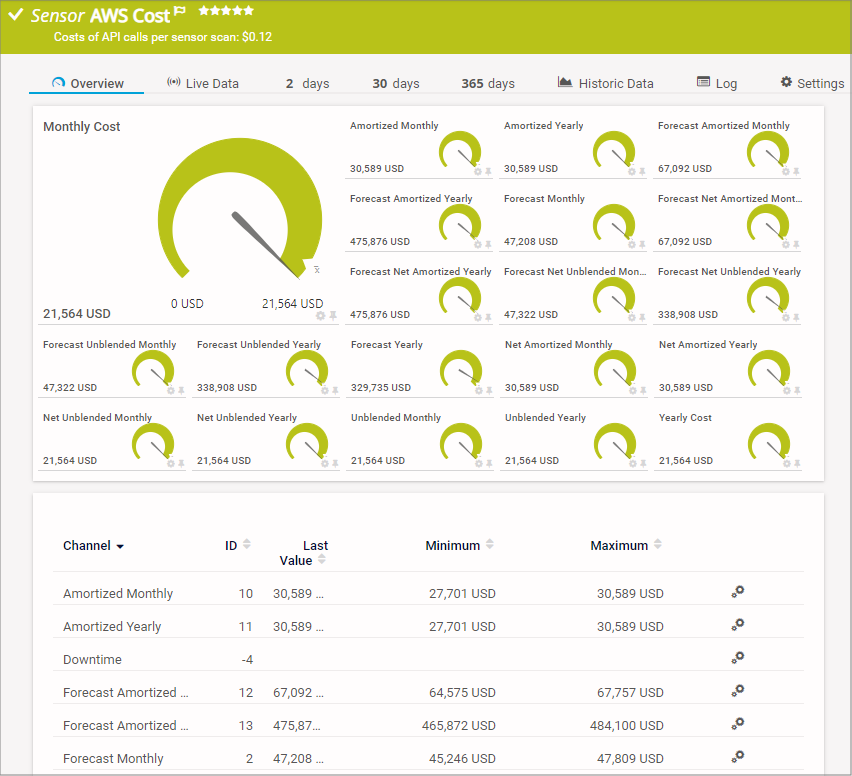
The AWS Cost sensor monitors the cost of an Amazon Web Services (AWS) account by reading its data from the AWS Cost Explorer API. It can show the following:

  • (Forecast for) amortized cost per month and year
  • (Forecast for) net amortized cost per month and year
  • (Forecast for) net unblended cost per month and year
  • (Forecast for) unblended cost per month and year
  • (Forecast for) monthly and yearly cost
AWS Cost
AWS Cost

AWS Alarm v2

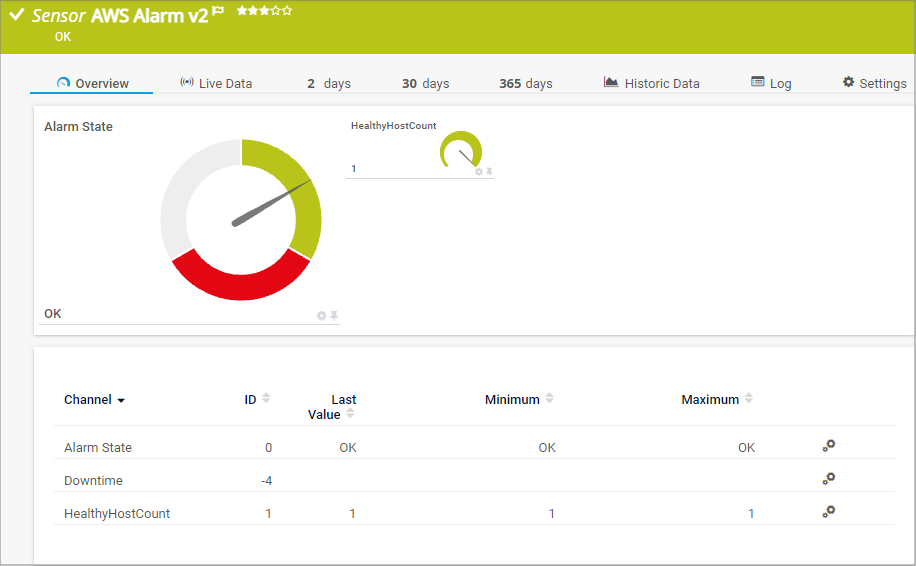
The AWS Alarm v2 sensor monitors the status of an Amazon Web Services (AWS) alarm by reading its data from Amazon CloudWatch via the AWS API. It can show the following:

  • Alarm status
  • Metric on which the alarm is based
AWS Alarm v2
AWS Alarm v2

AWS EBS v2

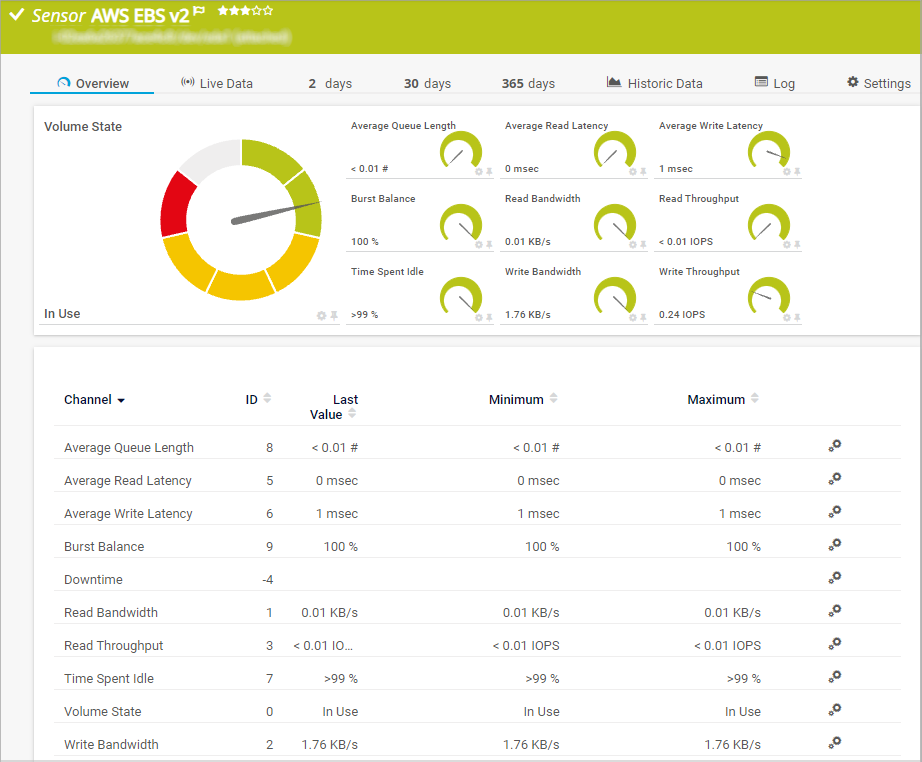
The AWS EBS v2 sensor monitors the performance of an Amazon Web Services (AWS) Elastic Block Store (EBS) volume by reading its data from Amazon CloudWatch via the AWS API. It can show the following:

  • Average queue lengths
  • Average read and write latency
  • Time spent idle
  • Burst balance
  • Read and write bandwidth and throughput in IOPS
AWS EBS v2
AWS EBS v2

AWS EC2 v2

The AWS EC2 v2 sensor monitors the performance of an Amazon Web Services (AWS) Elastic Compute Cloud (EC2) instance by reading its data from Amazon CloudWatch via the AWS API. It can show the following:

  • CPU credit balance and usage
  • Disk read and write speed
  • Number of disk read and write operations
  • AWS EC2 instance and system status
  • Incoming and outgoing network load
AWS EC2 v2
AWS EC2 v2

AWS ELB v2

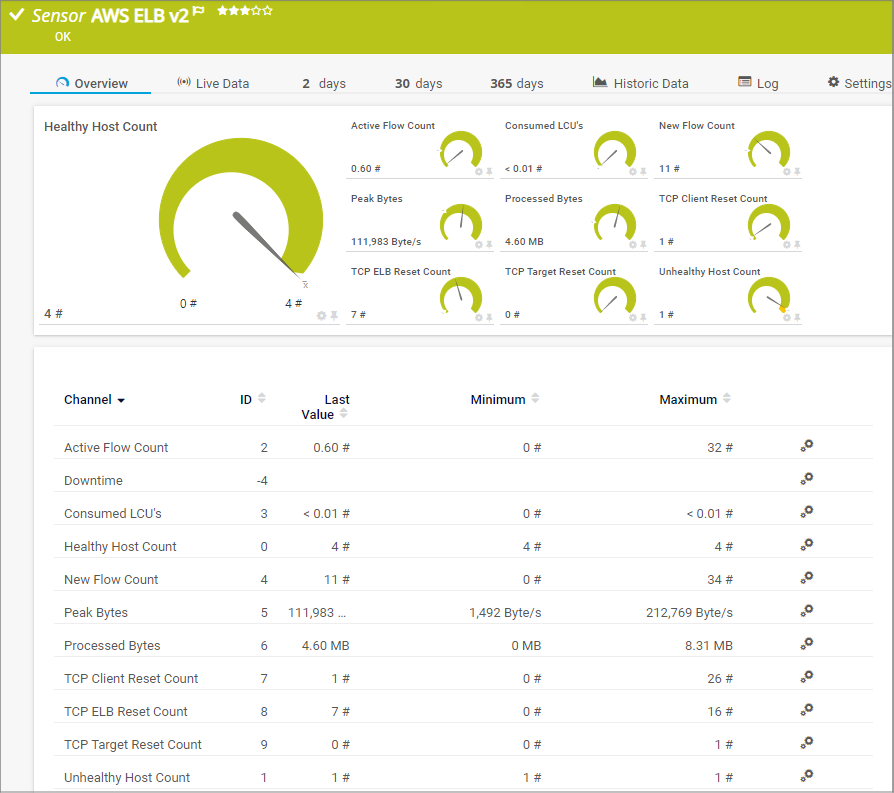
The AWS ELB v2 sensor monitors the performance of an Amazon Web Services (AWS) Elastic Load Balancing (ELB) load balancer by reading its data from Amazon CloudWatch via the AWS API. It can show the following and more:

  • Number of new and concurrent active TCP connections and flows
  • Number of LCU used by the load balancer
  • Number of HTTP 4XX and HTTP 5XX client error codes and response codes generated by the targets
  • Number of targets that are considered healthy or unhealthy
  • Response time of the target
AWS ELB v2
AWS ELB v2

AWS RDS v2

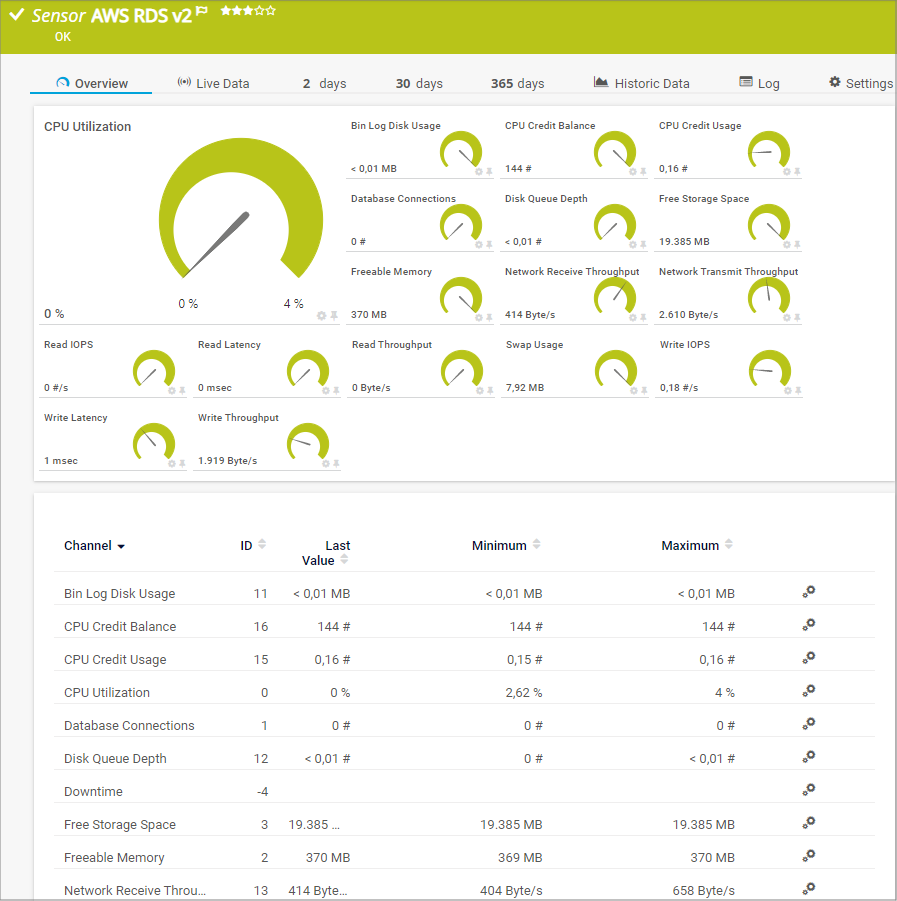
The AWS RDS v2 sensor monitors the performance of a Amazon Web Services (AWS) Relational Database Service (RDS) database by reading its data from Amazon CloudWatch via the AWS API. It can show the following and more:

  • CPU credit balance and usage
  • Average number of database connections in use
  • Number of (outstanding) disk read and write operations
  • Amount of available storage space
  • Incoming (receive) and outgoing (transmit) network traffic
AWS RDS v2
AWS RDS v2

See the PRTG Manual for a list of all available sensor types.

PRTG is compatible with all major vendors, products, and systems

compatible with all major vendors, products, and systems

PRTG makes EC2 monitoring as easy as it gets

Custom alerts and data visualization let you quickly identify and prevent issues in your EC2 web service.

Free download
PRODUCT OVERVIEW

“Since using PRTG, we have matured how we report out overall application uptime, maintenance, and mean time between failure for all critical applications to our board of directors. PRTG allows us to not just look at a single event, but to leverage historical data to prevent future failures and to measure how we are making improve­ments over time.”

Bill Sorrells, CTO
Dayton Children's Hospital

“We have found these sophisticated levels of monitoring to be highly effective, improving the end user’s experience of the systems and applications in use, giving us the opportunity to provide a proactive resolution rather than having the end user raise issues.”

Saif Akil, Head of Service Management
Acurus

“Before PRTG, applications and hardware all gave messages, but all separately, so we had to search through hundreds of e-mails to find the problem. It was always only afterwards that we saw that something was going on within the infrastructure. To mitigate the issue, we also considered other software. PRTG stood out because of its user-friendliness, flexibility and minimal consultancy investment.”

Wim Vandenberghe, ICT Manager
Soenen Golfkarton

Your EC2 monitor at a glance – even on the go

PRTG is set up in a matter of minutes and can be used on a wide variety of mobile devices.

device overview
aws

We are an AWS Technology Partner  

Paessler is a certified partner in the Amazon Web Services ecosystem, which includes a growing community of software vendors who are building solutions on cloud computing.

What does this mean for you?

  • Easy integration of AWS services and CloudWatch data with PRTG
  • State-of-the-art features for monitoring your cloud environment
  • Expert technical support around your AWS monitoring setup

Create innovative solutions with Paessler’s IT partners

Partnering with innovative IT vendors, Paessler unleashes synergies to create
new and additional benefits for joined customers.

ScriptRunner

ScriptRunner

With ScriptRunner Paessler integrates a powerful event automation platform into PRTG Network Monitor.

Read more
UVnetworks

UVnetworks

UVexplorer integrates tightly with PRTG to bring fast and accurate network discovery, detailed device inventory, and automatic network mapping to the PRTG platform.

Read more
baramundi

baramundi

baramundi and PRTG create a secure, reliable and powerful IT infrastructure where you have everything under control - from the traffic in your firewall to the configuration of your clients.

Read more

Find the root cause of the problem with our PRTG EC2 monitoring solution

Real-time notifications mean faster troubleshooting so that you can act before more serious issues occur.

Free download
PRODUCT OVERVIEW
Paessler PRTG

Paessler PRTG

Network Monitoring Software – Version 24.4.102.1351 (November 12th, 2024)

Hosting icon

Hosting

Download for Windows and cloud-based version PRTG Hosted Monitor available

Languages icon

Languages

English, German, Spanish, French, Portuguese, Dutch, Russian, Japanese, and Simplified Chinese

test

Monitor everything

Network devices, bandwidth, servers, applications, virtual environments, remote systems, IoT, and more

test

Pricing

Choose the PRTG Network Monitor subscription that's best for you

EC2 Monitoring: FAQ


What is AWS EC2?

Amazon Web Services Elastic Compute Cloud (AWS EC2) is a web service that provides scalable computing capacity in the cloud. With EC2, users can run virtual servers, known as instances, to host applications, run workloads, or perform various computing tasks without needing to invest in physical hardware.

Why should I monitor my AWS EC2 infrastructure?

With monitoring your AWS EC2 setup, you are able to catch problems early and keep your AWS services costs under control. Without monitoring, you might miss resource overuse, performance issues, downtime or unexpected expenses.

What are the key aspects of monitoring EC2?

Key aspects of monitoring EC2 include tracking CPU utilization, memory usage, disk I/O, and network performance. Additionally, monitoring system health, instance availability, and security-related metrics like failed login attempts are essential to maintaining a robust and secure infrastructure.

How can I keep track of my AWS costs with PRTG?

PRTG offers an AWS Cost sensor that monitors your credit balance in real time. It provides insights into your AWS usage costs, and help you to identify trends, optimize workloads, resource allocation, and prevent budget overruns by setting up alerts when resource usage pricing exceed predefined thresholds.

What AWS metrics can I monitor with PRTG?

With PRTG, you can monitor a wide range of AWS metrics, including CPU utilization, memory and storage usage, network traffic, and other system-level metrics. Additionally, PRTG supports monitoring specific AWS services like Elastic Block Store (EBS), Elastic Load Balancing (ELB), and Relational Database Service (RDS). All these aspects allow you to have a comprehensive visibility across your entire AWS environment.

What is a sensor in PRTG?

In PRTG, “sensors” are the basic monitoring elements. One sensor usually monitors one measured value in your network, for example the traffic of a switch port, the CPU load of a server, or the free space on a disk drive. On average, you need about 5-10 sensors per device or one sensor per switch port.

We asked: would you recommend PRTG? Over 95% of our customers say yes!

Paessler conducted trials in over 600 IT departments worldwide to tune its network monitoring software closer to the needs of sysadmins. The result of the survey: over 95% of the participants would recommend PRTG – or already have.

recommendation

Still not convinced?

Love

More than 500,000 sysadmins love PRTG

Paessler PRTG is used by companies of all sizes. Sysadmins love PRTG because it makes their job a whole lot easier.

PRTG

Monitor your entire IT infrastructure

Bandwidth, servers, virtual environments, websites, VoIP services – PRTG keeps an eye on your entire network.

test

Try Paessler PRTG for free

Everyone has different monitoring needs. That’s why we let you try PRTG for free.

PRTG Logo

Start monitoring EC2 with PRTG and see how it can make your network more reliable and your job easier.

Free download
PRODUCT OVERVIEW

Products

  • Paessler PRTG
    Paessler PRTGMonitor your whole IT infrastructure
    • PRTG Network Monitor
    • PRTG Enterprise Monitor
    • PRTG Hosted Monitor
    • PRTG extensions
      Extensions for Paessler PRTGExtend your monitoring to a new level
  • Icon Features
    FeaturesExplore all monitoring features

Monitoring with PRTG

  • Network monitoring
  • Bandwidth monitoring
  • SNMP monitoring
  • Network mapping
  • Wi-Fi monitoring
  • Server monitoring
  • Network traffic analyzer
  • NetFlow monitoring
  • Syslog server

Useful Links

  • PRTG Manual
  • Knowledge Base
  • Customer Success Stories
  • About Paessler
  • Subscribe to newsletter
  • PRTG Support
  • PRTG Consulting

Contact

Paessler GmbH
Thurn-und-Taxis-Str. 14, 
90411 Nuremberg 
Germany

info@paessler.com

+49 911 93775-0

  • Contact us
©2025 Paessler GmbHTerms & ConditionsPrivacy PolicyImprintReport VulnerabilityDownload & InstallSitemap
404 - Page not found 404 - Page not found 404 - Page not found