• Company
    • About Us
    • Case Studies
    • Press Center
    • Events
    • Careers
    • Blog
    • Contact us
  • Contact us
  • Login
 
  • English
    • Deutsch
    • Español
    • Français
    • Italiano
    • Português
Paessler
                    - The Monitoring Experts
  • Products
    • Paessler PRTG
      Paessler PRTGMonitor your whole IT infrastructure
      • PRTG Network Monitor
      • PRTG Enterprise Monitor
      • PRTG Hosted Monitor
      • PRTG extensionsExtensions for Paessler PRTGExtend your monitoring to a new level
    • Icon Features
      FeaturesExplore all monitoring features
      • Maps & dashboards
      • Alerts & notifications
      • Multiple user interfaces
      • Distributed monitoring
      • Customizable reporting
  • Solutions
    • Industries
      IndustriesMonitor various industry sectors
      • Industrial
      • Healthcare
      • Data Center
      • Education
      • Finance
      • Government
    • IT Topics
      IT TopicsMonitor all areas of IT
      • Network Monitoring
      • Bandwidth Monitoring
      • SNMP Monitor
      • Network Mapping
      • WiFi Monitoring
      • Server Monitoring
  • Pricing
  • Resources
    • Getting Started
      Getting StartedModules for self-paced learning
    • How-to Guides
      How-to GuidesGet the most out of PRTG
    • Videos & Webinars
      Videos & WebinarsLearn from Paessler experts
    • IT  Knowledge
      IT KnowledgeExpand your IT knowledge
    • PRTG Manual
      PRTG ManualFull documentation
    • Knowledge Base
      Knowledge BaseShare community knowledge
    • PRTG Sensor Hub
      PRTG Sensor HubGet sensors, scripts & templates
    • Trainings
      PRTG TrainingLearn how to work with PRTG
  • Partners
    • icon star
      New Partners and MSPBecome a new partner or MSP
    • icon partner
      Partner PortalLog in to your partner account
    • icon search
      Find a PartnerFind partners selling Paessler products
    • icon technology
      Technology AlliancesSee Paessler technology partnerships
  • Company
    • About Us
    • Case Studies
    • Press Center
    • Events
    • Careers
    • Blog
    • Contact us
  • Contact us
  • Login
  • English
    • Deutsch
    • Español
    • Français
    • Italiano
    • Português
  • Get a quote
  • Free trial
  1. Home>
  2. IT Topics>
  3. Application>
  4. NFS Monitoring Tool
PRTG Logo

NFS Monitoring with PRTG

Stay ahead of file system issues in your network

  • Detect performance bottlenecks in real time
  • Benefit from instant alerts for NFS server and client issues
  • Ensure fast and uninterrupted file system access
Free download
product overview

Our users give top ratings for monitoring with Paessler PRTG

Gartner peer insights
spiceworks
Capterra
G2
Trustpilot

PRTG NFS monitoring: What you will find on this page

Table of content
  • Achieve seamless file system management with NFS monitoring
  • What NFS monitoring looks like in PRTG
  • 3 reasons why to choose PRTG as your NFS monitoring tool
  • Preconfigured PRTG sensor types for NFS monitoring
  • Monitoring NFS: FAQ

PRTG makes NFS monitoring as easy as it gets

Custom alerts and data visualization let you quickly identify and prevent performance bottlenecks and file system outages.

Free download
PRODUCT OVERVIEW

Achieve seamless file system management with NFS monitoring

Imagine having a clear, real-time overview of your entire file system infrastructure, where potential issues are spotted before they disrupt your workflow. With Paessler PRTG, you can achieve exactly that by continuously monitoring NFS (Network File System). Whether you're managing large-scale enterprise environments or smaller networks, the ability to track file system performance, access, and availability is essential.

Easy setup und customization

Quickly configure NFS sensors to suit your specific environment and monitoring needs without complex setup processes.

Receive real-time alerts

Receive instant notifications when NFS-related issues arise, allowing for immediate action to prevent downtime or data loss.

Benefit from individual reports

Generate detailed performance and health reports for NFS, providing actionable insights into trends, bottlenecks, and system status.

See everything at a glance

Benefit from a centralized dashboard that visualizes NFS performance data, making it easy to monitor and manage your systems from one place.

Minimize downtime

With PRTG, you can rest assured that files on your network shares are always accessible and downtime is minimized. Focus on what matters most: driving your business forward.

Stay scalable for any environment

Whether you’re monitoring a small network or a global infrastructure, PRTG scales to meet your growing needs.

What NFS monitoring looks like in PRTG

Diagnose network issues by continuously tracking the status of your Network File Service. Show network throughput, bandwidth bottlenecks, and other key metrics in real time. Visualize monitoring data in clear graphs and dashboards to identify problems more easily. Gain the overview you need to troubleshoot any outages of your network file system.

PRTG Screenshot device tree view

Device tree view of the complete monitoring setup

PRTG screenshot map entire it infrastructure

Custom PRTG dashboard for keeping an eye on the entire IT infrastructure

PRTG screenshot graph live data traffic

Live traffic data graph in PRTG

Start Network File System monitoring with PRTG and see how it can make your network more reliable and your job easier.

Free download
PRODUCT OVERVIEW

IT experts agree: Paessler PRTG is a great solution for IT infrastructure monitoring

PCMag

“All-around winning
 network monitor”

IT Brief

“The real beauty of PRTG is the endless possibilities it offers”

ITPro

“PRTG Network Monitor 
is very hard to beat”

3 reasons why PRTG is the NFS monitoring tool of your choice

on-prem or cloud

Use PRTG on-prem or in the cloud? You decide!

If you need a cloud-based monitoring solution, PRTG Hosted Monitor offers all the power of PRTG without the need for any local hardware.

This solution ensures that your network and critical infrastructure can be monitored from anywhere with minimal setup. Whether you’re running a fully cloud-based system or a hybrid network, PRTG adapts to fit your needs.

subscription

A licensing model that grows with your needs

With PRTG, we offer a range of flexible subscription-based licenses that can grow with your business needs. Whether you are managing a small IT environment or a large enterprise infrastructure, PRTG scales without effort.

Our licensing model ensures continued access to the latest product updates, security patches, and technical support. Start small and upgrade as your needs evolve.

updated

Get updates and continuous innovation

We constantly listen to feedback from our customers – you – to ensure that we are always at the forefront of innovation.

Enjoy regular release product updates to make sure PRTG remains up to date with the latest technologies and continues to meet evolving IT requirements. These updates include new features, performance enhancements, and security improvements.

Explore our preconfigured PRTG sensors for NFS monitoring

PRTG comes with more than 250 native sensor types for monitoring your entire on-premises, cloud, and hybrid cloud environment out of the box. Check out some examples below!

SNMP Linux Disk Free

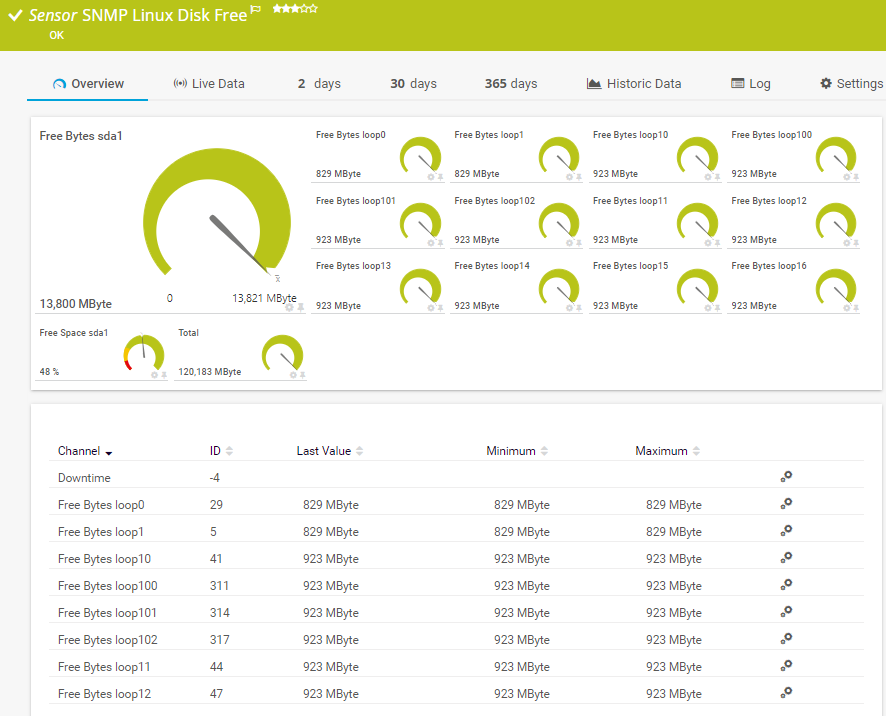
The SNMP Linux Disk Free sensor monitors the free space on disks of a Linux/Unix system. It can show the following:

  • Free space
  • Free index nodes
  • Free total disk space
SNMP Linux Disk Free

SNMP Linux Load Average

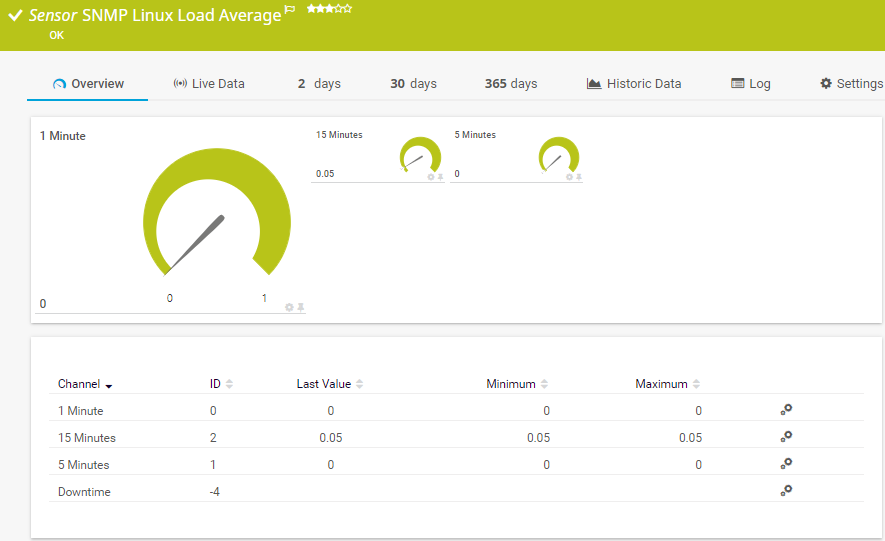
The SNMP Linux Load Average sensor monitors the system load average of a Linux/Unix system. It can show the following:

  • Average system load within a 1-minute interval
  • Average system load within a 5-minute interval
  • Average system load within a 15-minute interval
SNMP Linux Load Average

File

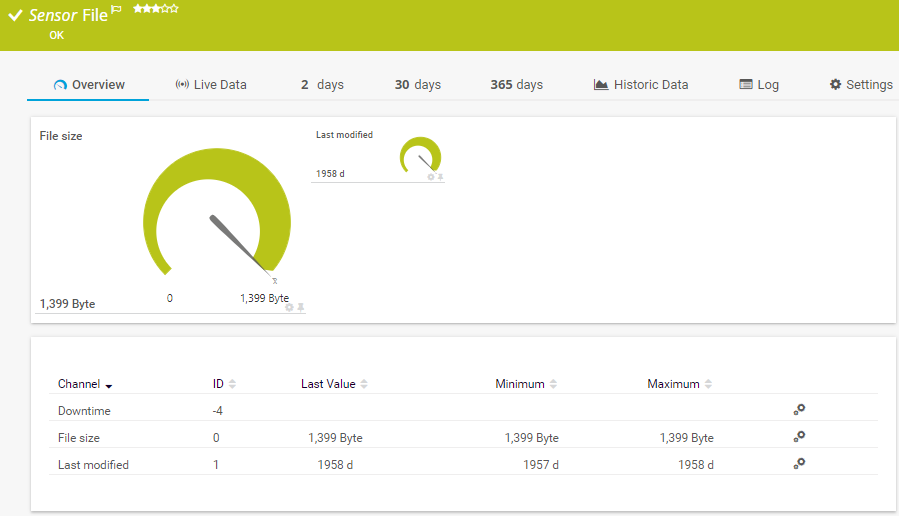
The File sensor monitors a file located on the local disk on the probe system, parent device, or a file that is accessible via Server Message Block (SMB). It can show the following:

  • File size
  • Time since the last modification of a file
File
File

While not preconfigured as an “NFS-specific” sensor, you can use the flexibility of PRTG to create custom NFS client monitoring (for example on Windows) through scripts or SNMP traps in real time. These can track NFS client-server communication, file transfer performance monitoring, and connection reliability.

See the PRTG Manual for a list of all available sensor types.

PRTG is compatible with all major vendors, products, and systems

compatible with all major vendors, products, and systems

PRTG makes NFS monitoring as easy as it gets

Custom alerts and data visualization let you quickly identify and prevent performance bottlenecks and file system outages.

Free download
PRODUCT OVERVIEW

“Since using PRTG, we have matured how we report out overall application uptime, maintenance, and mean time between failure for all critical applications to our board of directors. PRTG allows us to not just look at a single event, but to leverage historical data to prevent future failures and to measure how we are making improve­ments over time.”

Bill Sorrells, CTO
Dayton Children's Hospital

“We have found these sophisticated levels of monitoring to be highly effective, improving the end user’s experience of the systems and applications in use, giving us the opportunity to provide a proactive resolution rather than having the end user raise issues.”

Saif Akil, Head of Service Management
Acurus

“Before PRTG, applications and hardware all gave messages, but all separately, so we had to search through hundreds of e-mails to find the problem. It was always only afterwards that we saw that something was going on within the infrastructure. To mitigate the issue, we also considered other software. PRTG stood out because of its user-friendliness, flexibility and minimal consultancy investment.”

Wim Vandenberghe, ICT Manager
Soenen Golfkarton

Your NFS monitor at a glance – even on the go

PRTG is set up in a matter of minutes and can be used on a wide variety of mobile devices.

device overview
aws

We are an AWS Technology Partner  

Paessler is a certified partner in the Amazon Web Services ecosystem, which includes a growing community of software vendors who are building solutions on cloud computing.

What does this mean for you?

  • Easy integration of AWS services and CloudWatch data with PRTG
  • State-of-the-art features for monitoring your cloud environment
  • Expert technical support around your AWS monitoring setup

Create innovative solutions with Paessler’s IT partners

Partnering with innovative IT vendors, Paessler unleashes synergies to create
new and additional benefits for joined customers.

NetBrain

NetBrain

Integrating monitoring results from PRTG into NetBrain maps makes the foundation for network automation.

Read more
Rittal

Rittal

IT that works constitutes a business-critical basis for a company's success. Availability and security must be defined for the respective purpose and closely monitored – by OT and IT alike.

Read more
ScriptRunner

ScriptRunner

With ScriptRunner Paessler integrates a powerful event automation platform into PRTG Network Monitor.

Read more

Find the root cause of the problem with our PRTG NFS monitoring solution

Real-time notifications mean faster troubleshooting so that you can act before more serious issues occur.

Free download
PRODUCT OVERVIEW
Paessler PRTG

Paessler PRTG

Network Monitoring Software – Version 25.2.106.1114 (May 05th, 2025)

Hosting icon

Hosting

Download for Windows and cloud-based version PRTG Hosted Monitor available

Languages icon

Languages

English, German, Spanish, French, Portuguese, Dutch, Russian, Japanese, and Simplified Chinese

test

Monitor everything

Network devices, bandwidth, servers, applications, virtual environments, remote systems, IoT, and more

test

Pricing

Choose the PRTG Network Monitor subscription that's best for you

NFS Monitoring: FAQ


What is NFS and when do I use it?

Network File System (NFS) is a protocol that allows users to access and share files across different computers in a network as if they were on the local machine. It is widely used in Linux and Unix environments to provide shared access to file systems across network devices. You would typically use NFS in scenarios where multiple clients need to access the same data, such as in data centers, cloud environments, or any setup requiring distributed file storage.

Why is it important to monitor NFS?

Monitoring NFS is critical because it helps prevent performance degradation, file system outages, and data loss. With Paessler PRTG, you can track key metrics like disk usage, file access times, and network latency, which ensures that file systems remain available and operate efficiently. Monitoring also helps detect bottlenecks and allows for proactive maintenance, to ensure minimal downtime and optimal data access performance.

What specific NFS performance metrics should I monitor?

Key metrics for monitoring NFS performance include:

  • Disk space, disk usage and free space: Ensures NFS volumes don’t run out of space.
  • Disk I/O performance: Measures the speed of read and write operations on the NFS system.
  • CPU load: Tracks how NFS processes affect system performance.
  • Network latency: Identifies potential delays in accessing files over the network.
  • File system errors: Detects problems with file integrity or data corruption.

Preconfigured PRTG sensor types such as the SNMP Linux Disk Free sensor or the SNMP Linux Load Average sensor even help to effectively monitor metrics like mount points, or NFS mounts in general.

What is a sensor in PRTG?

In PRTG, “sensors” are the basic monitoring elements. One sensor usually monitors one measured value in your network, for example the traffic of a switch port, the CPU load of a server, or the free space on a disk drive. On average, you need about 5-10 sensors per device or one sensor per switch port.

We asked: would you recommend PRTG? Over 95% of our customers say yes!

Paessler conducted trials in over 600 IT departments worldwide to tune its network monitoring software closer to the needs of sysadmins. The result of the survey: over 95% of the participants would recommend PRTG – or already have.

recommendation

Still not convinced?

Love

More than 500,000 sysadmins love PRTG

Paessler PRTG is used by companies of all sizes. Sysadmins love PRTG because it makes their job a whole lot easier.

PRTG

Monitor your entire IT infrastructure

Bandwidth, servers, virtual environments, websites, VoIP services – PRTG keeps an eye on your entire network.

test

Try Paessler PRTG for free

Everyone has different monitoring needs. That’s why we let you try PRTG for free.

PRTG Logo

Start Network File System monitoring with PRTG and see how it can make your network more reliable and your job easier.

Free download
PRODUCT OVERVIEW

Products

  • Paessler PRTG
    Paessler PRTGMonitor your whole IT infrastructure
    • PRTG Network Monitor
    • PRTG Enterprise Monitor
    • PRTG Hosted Monitor
    • PRTG extensions
      Extensions for Paessler PRTGExtend your monitoring to a new level
  • Icon Features
    FeaturesExplore all monitoring features

Monitoring with PRTG

  • Network monitoring
  • Bandwidth monitoring
  • SNMP monitoring
  • Network mapping
  • Wi-Fi monitoring
  • Server monitoring
  • Network traffic analyzer
  • NetFlow monitoring
  • Syslog server

Useful Links

  • PRTG Manual
  • Knowledge Base
  • Customer Success Stories
  • About Paessler
  • Subscribe to newsletter
  • PRTG Support
  • PRTG Consulting

Contact

Paessler GmbH
Thurn-und-Taxis-Str. 14, 
90411 Nuremberg 
Germany

info@paessler.com

+49 911 93775-0

  • Contact us
©2025 Paessler GmbHTerms & ConditionsPrivacy PolicyImprintReport VulnerabilityDownload & InstallSitemap
404 - Page not found 404 - Page not found 404 - Page not found